Home Page
Click on a screen region below to learn more about the Velocity+ Command Center Home page for carriers, brokers, and shippers:
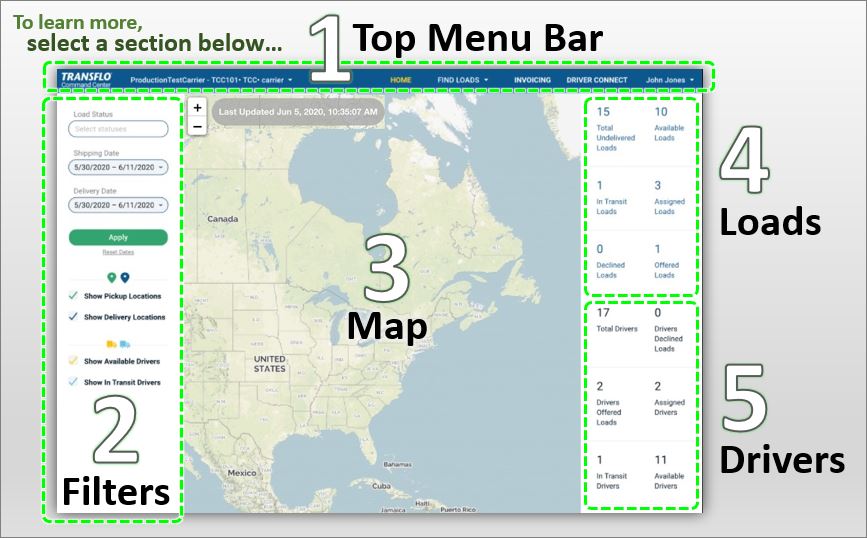
Tip: Section 5 Drivers is not available to brokers or shippers and section 4 is not available to shippers. The following image shows a typical Home page example for a broker:
After you start a new user session in your web browser and log in to Velocity+, the Velocity+ Command Center main page or Home page appears with a main menu bar at the top.
The top menu bar shows the following menu items:
-
Company or Fleet: Depending on your business needs and subscription with Transflo (a Pegasus TransTech Company, you can switch your company, carrier, broker, fleet, division, or shipper.
-
HOME: To return to the main page with the familiar map, click HOME.
-
CREATE LOAD: Click this option to enter details about a new load.
-
FIND LOADS: Click this option to find carrier, broker, or shipper loads. As a broker, your configuration might show you carrier-assigned loads. As a carrier, you can typically view the My Loads page and also view a Broker Offers option.
-
INVOICING: Click this menu item to view invoices or create an invoice for a load. After load delivery, you can create an invoice with the appropriate line items and documents that you need to send to the broker for payment. You can create invoices for loads that were originally sent by a broker using Velocity+.
-
DRIVER CONNECT: Some carrier configurations include this menu item to add drivers and to access driver communication, chat, load tracking, maps, and delivery status features.
-
USERNAME: Click your username in the top right corner to access the following sub-features:
-
My Profile: Depending on your configuration, you can edit your personal user profile or your company profile.
-
Customer Access Management: If your subscription with Transflo supports access to this restricted administrative feature, you can configure access rights for other users.
-
Welcome: Optional summary information.
-
Help: This menu option provides direct access to the Transflo Velocity+ knowledge base articles. To find immediate answers to most questions about popular features, we encourage you to search the knowledge base and send us your feedback.
-
About: This menu option shows you the current release version of your Velocity+ software.
-
Logout: Use this menu option to secure your account when not in use. When your user session is done, log out to prevent unauthorized access to your account.
-
Apply one or more filters in the section on the left side of the Home page to focus on the load data of most importance to you. Your filters determine what shows on the map.
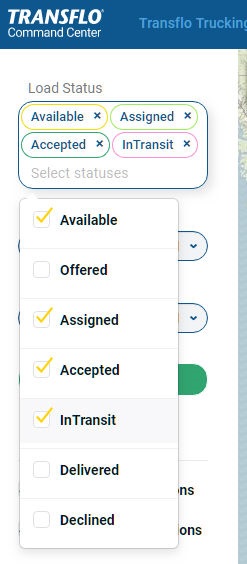
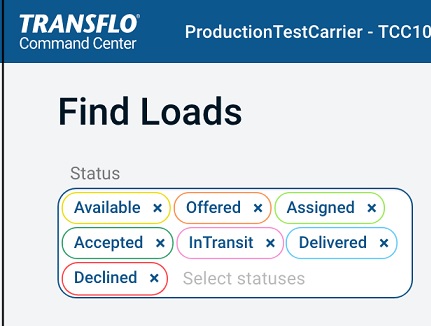
Load Status: You can select one or more load status values to filter the loads that appear on the map by status. The values are listed below:
-
Available
-
Offered
-
Assigned
-
Accepted
-
InTransit
-
Delivered
-
Declined
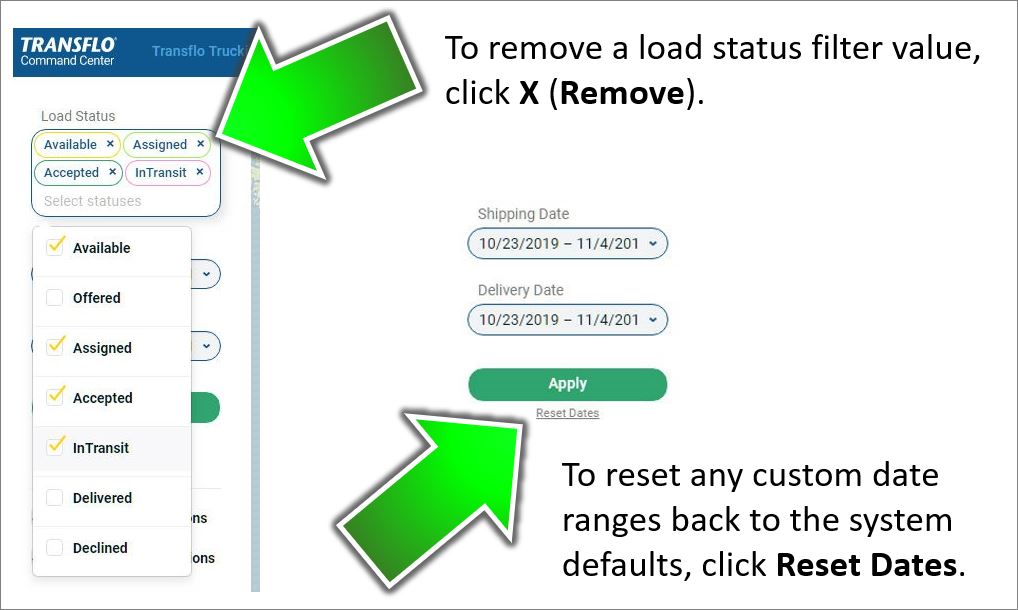
In the following example image, the user wants the map to show only loads with a status of Available, Assigned, Accepted, or InTransit.
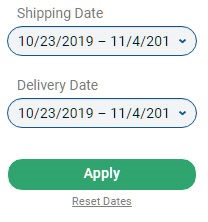
Shipping Date and Delivery Date: You can find loads on the map that fall within date ranges for shipping, delivery, or both.
-
The steps to define these optional date filters are the same as the steps for the FIND LOADS and INVOICING pages. The default dates are also the same.
-
To reset the date ranges, click Reset Dates.
-
Although they are helpful and recommended to improve performance, the date filter fields are optional.
-
To clear these and other filters, see Clear Filters on the HOME Page further down in this article.
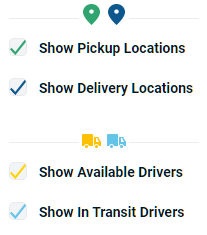
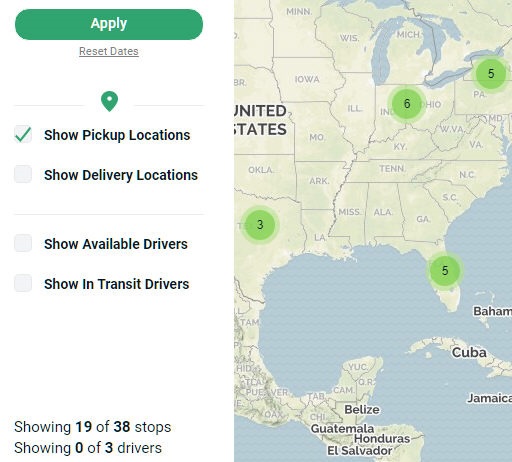
Show Pickup Locations: Select this option to view the origin for loads on the map. Clear this option to hide the pickup locations. (For example, to focus on delivery locations or drivers instead.)
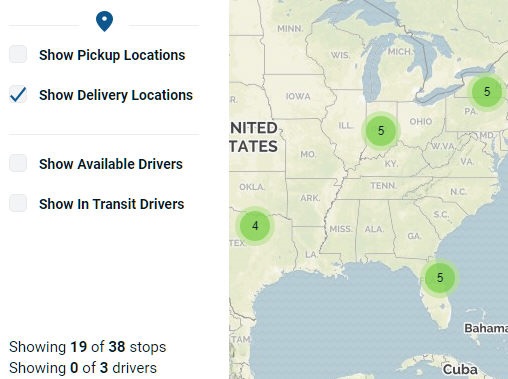
Show Delivery Locations: Select this option to view the destinations for loads on the map. Clear this option to hide the drop-off locations. (For example, to focus on pickup locations or drivers instead.)
For carriers only, the Home page filters include two more options:
Show Available Drivers: Select this option to view eligible drivers on the map. These are drivers who...
-
completed their mobile app registration (see Set Up a Transflo Mobile+ Account)
-
are visible in the system (their show/hide setting is set to Show)
-
are not already in-transit on an assigned load.
Show In-Transit Drivers: Select this option to view in-transit drivers on the map based on their mobile device location tracking data.
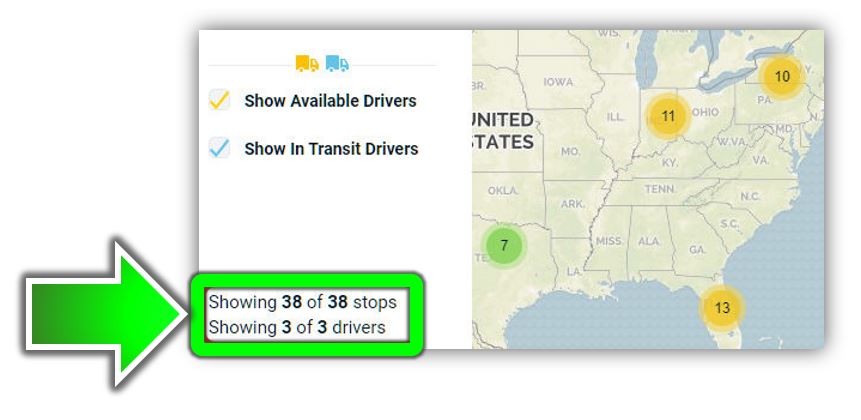
Map Metrics: The map metrics at the bottom left of the filter area indicate what portion of total stops and total drivers are displayed based on your filter criteria.
-
A stop is a pickup or delivery location. A typical load has two stops. Some can have more than one stop, including multiple pick-up or drop-off locations.
-
Drivers are added to the system, registered for the mobile app, and set to be visible (show/hide status set to Show) in the system.
In this example, the user wants to focus on pickup locations.
-
The user selects Show Pickup Locations.
-
The user clears the remaining options.
-
In the bottom left corner, the map metrics indicate that the map is showing 19 of 38 stops, all pickup locations.
-
In the bottom left corner, the map metrics indicate that the map is showing none (0) of the three (3) eligible drivers in the system.
-
All 19 stops marked on the map are pickup locations.
In this example, the user wants to focus on deliveries:
-
The user selects Show Delivery Locations.
-
The user clears the other options.
-
In the bottom left corner, the map metrics indicate that the map is showing 19 of 38 stops, all drop-off locations.
-
In the bottom left corner, the map metrics indicate that the map is showing none (0) of the three (3) eligible drivers in the system.
-
All 19 stops marked on the map are drop-off locations.
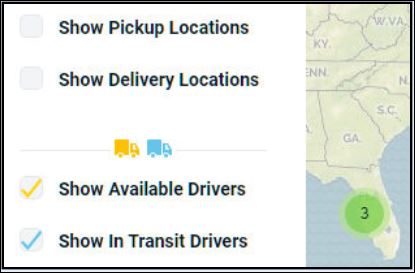
In this example for carriers (driver management features are not available for brokers or shippers), the user wants to view drivers on the map but does not want to view any stops:
-
The user selects Show Available Drivers and Show In-Transit Drivers.
-
The user clears the options for Show Pickup Locations and Show Delivery Locations.
-
In the bottom left corner, the map metrics (not shown here) would indicate that the map is showing 0 of 38 stops or 0 of 0 stops depending on the actual load data and date filters
-
In the bottom left corner, the map metrics (not shown here) would indicate that the map is showing all three (3) of the three (3) eligible drivers in the system for this example
Clear the filters when you want a clean unfiltered view of all your data or whenever you want to "start over" and define new filters.
-
In the top menu bar, click HOME.
-
To reset any custom date ranges back to the system defaults, click Reset Dates. This restores the default date ranges (last six days, today, next six days).
-
To clear a date range, triple-click in the field and then press the Delete key on your keyboard.
-
To manually clear any status values in the Load Status field, click X Delete to remove each one.
-
To remove the remaining filter options, clear their check boxes.
-
Click Apply.
In the map area, you can zoom out to view regional maps or zoom in to view progressively more detailed maps showing states, cities, and highways all the way down to surface streets and buildings. You can filter the maps and configure them to show or hide load data including pickup and drop-off locations (stops) and drivers.
Use the zoom control buttons in the upper left corner of the map to zoom in or out.
-
Click + Zoom In to see more detailed information.
-
Click - Zoom Out to view aggregated information spanning a larger region.
Tip: You can also configure a mouse wheel, trackpad, or other accessible pointing device to zoom in or out of the maps. See your operating system documentation.
To use the map, follow these steps and examples:
-
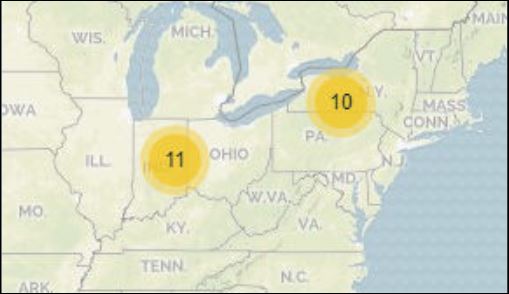
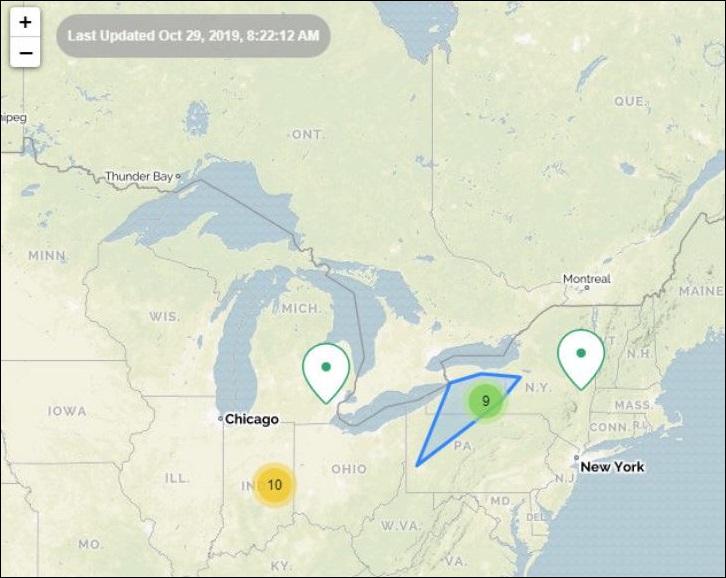
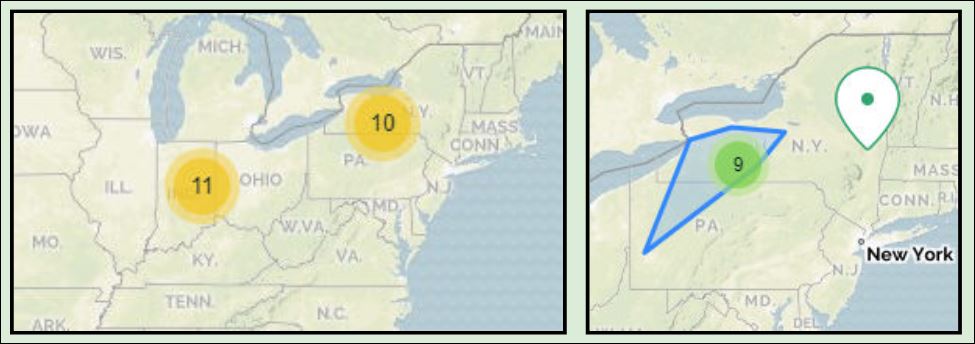
In this example, we see two sets of loads aggregated at a regional level:
-
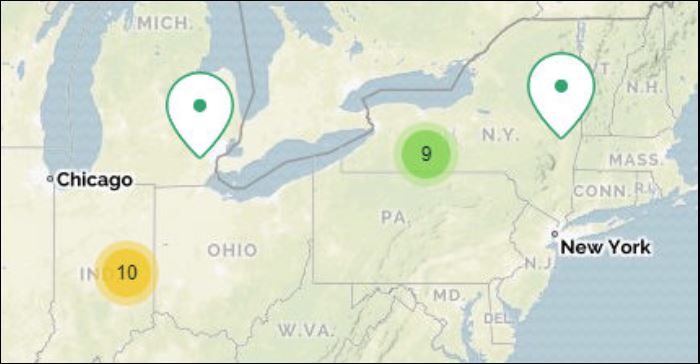
Click + Zoom In. At this zoom level, the map is able to break out the aggregated totals into separate locations, where it makes sense.
-
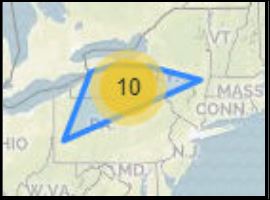
Click - Zoom Out to view the aggregated data another way. Mouse over the yellow 10.
-
Click + Zoom In. At this zoom level, the pickup location in Albany, NY is represented as its own stop on the map.
-
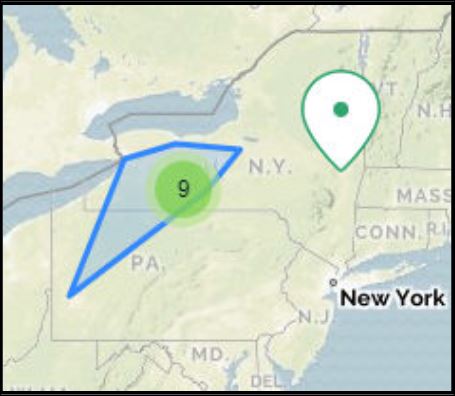
Hover over the green 9. The map cannot break out the stops at this zoom level; however, when you hover over the 9 aggregated stops, you can get an idea of the miles they cover. In the blue shaded load activity zone, you can begin to make out stops in upstate New York and at least one as far south as Pittsburgh, PA.
Tip: Don't be confused by the numbers inside circles shown on your map. The circles show logical groups of stops (pick-ups and drop-offs), and drivers if selected, all clustered into temporary groups by their simple proximity on a map. They might or might not share other details. For example, they could be from the same or different brokers. The grouping of data and the progressive disclosure of more detailed data points as you zoom in gives you a clean, clutter-free interface for working with loads and drivers on a map.
In this example, instead of clicking + Zoom In to progressively see more details, click directly on a group of loads. Try it on your own map!
-
In this example, we clicked on the green 9.
-
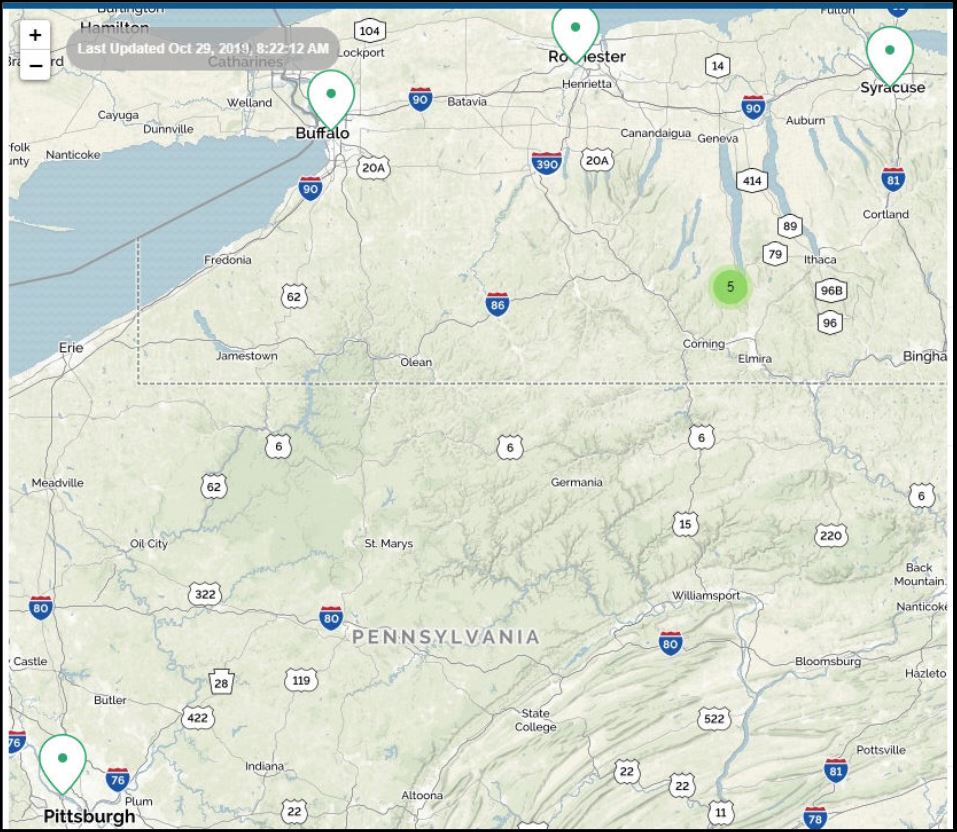
The map auto-zooms to show all 9 stops inside the current map view without having to scroll. Now you can see even more details about the extent of the load activity.
-
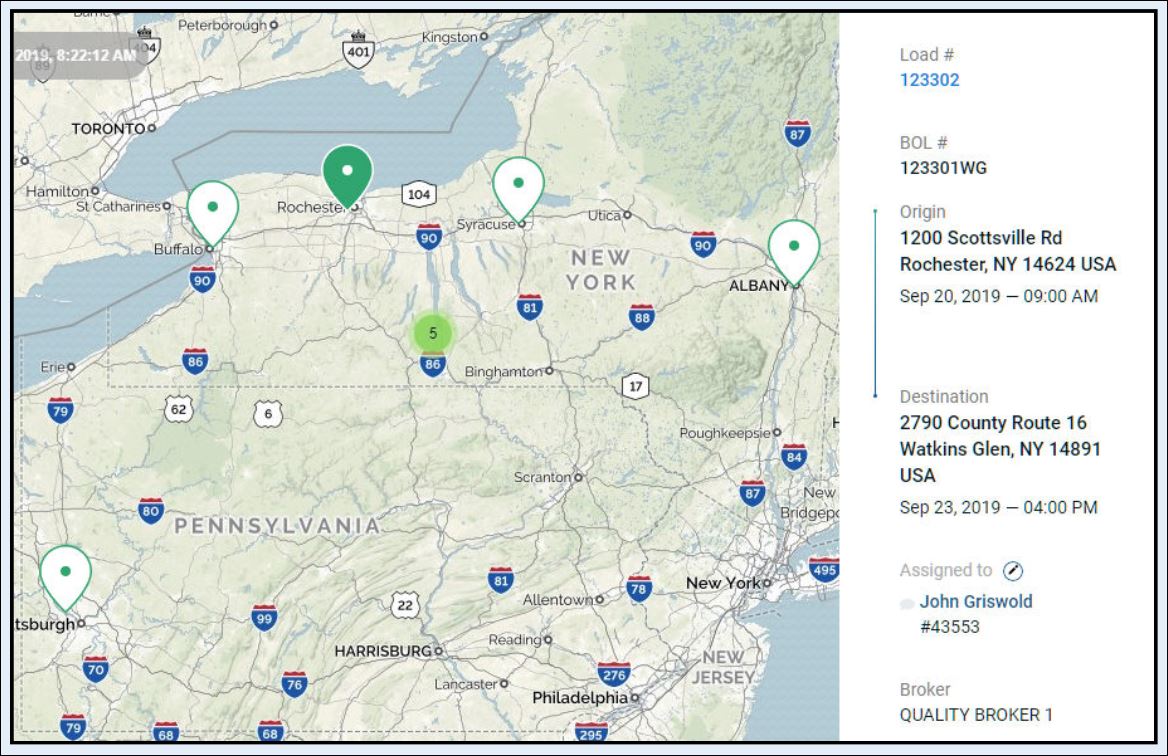
Click the green 5 to see what happens next!
-
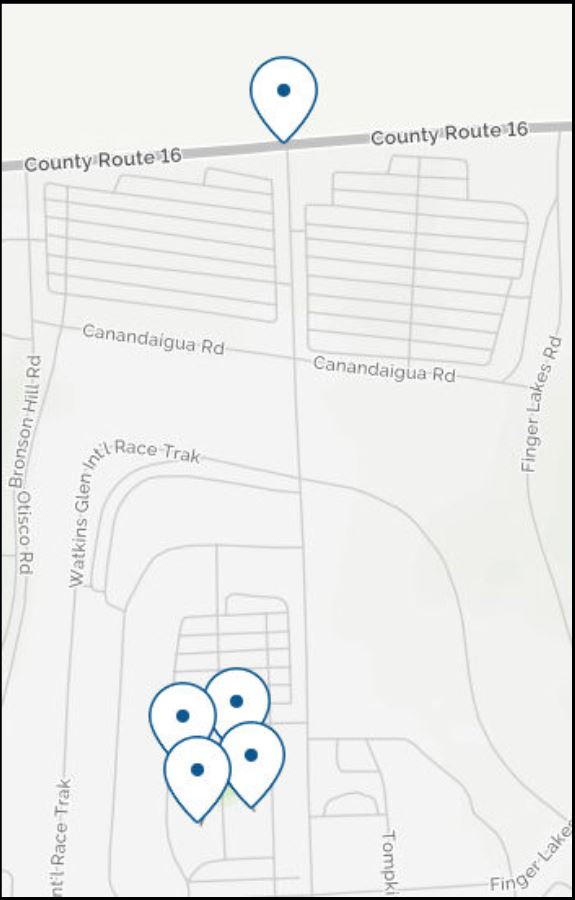
The map shows all five (5) stops. In this example, all five (5) are drop-off locations as shown.
Tip: If we pan the map in Step 2 to the east (click and drag right), we would see a fifth pickup location in Albany. Because that point and the stops in Pittsburgh, Buffalo, Rochester, and Syracuse are all shown using the green pickup location icon, you can infer that the green circle showing 5 consists only of drop-off locations.
Remember this zone started with 10 stops. After seeing the five (5) pickup locations, you know only the five (5) dropoff locations remain to be seen! (5 pickups + 5 dropoffs = 5 loads/10 stops in total)
In this example, you are going to click on a stop (in this case, a pick-up location). Follow the example below to click on a pick-up location on your own map!
-
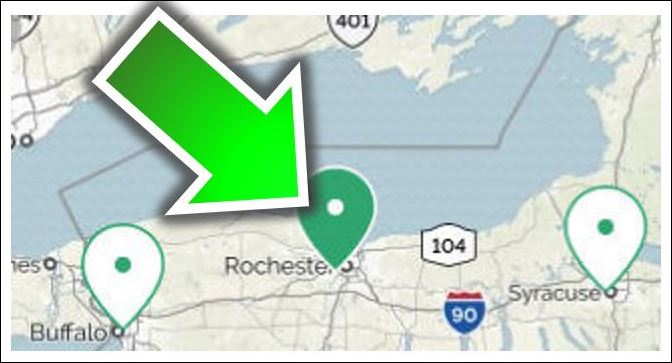
On the Home page map, click a pick-up location. In the example below, we clicked on the pick-up location map marker in Rochester, NY. The map marker inverted its colors to indicate it is the currently selected pick-up location.
-
Load details appear in the right panel. Use this feature to get load data without leaving the map.
-
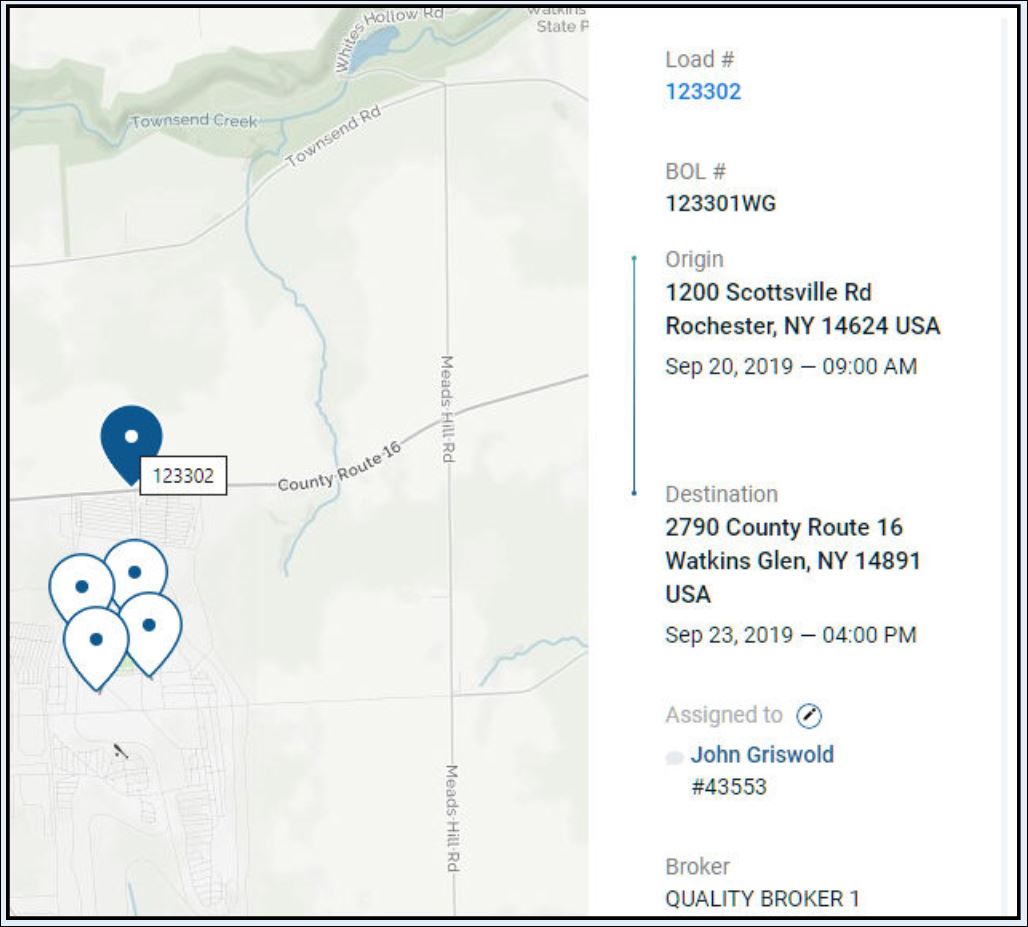
In this example, we clicked the green 5 to view all stops and then hovered over each stop to find load number 123302. Next, we clicked on a drop-off location marker on the map to see load information in the panel on the right where we can view the pick-up and drop-off details, assigned driver, and broker.
-
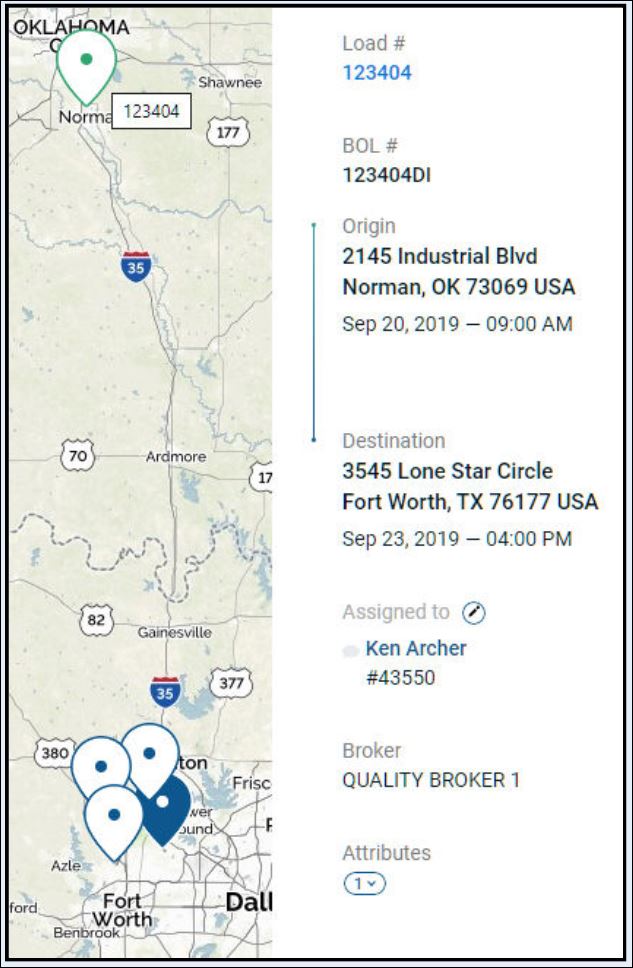
This next example shows the pick-up location up in Norman, Oklahoma and the drop-off location down in Fort Worth, Texas. We clicked the blue drop-off location to view the details in the right panel and then moused over the pick-up location in Oklahoma to verify the load numbers matched. This view is convenient because it shows you the direct route, the assigned driver, and other stops or deliveries in the area.

Tip: Click the load number in the right panel to view even more load information!
The following examples show how you can view drivers on the Home page maps (driver features are for carriers only).
-
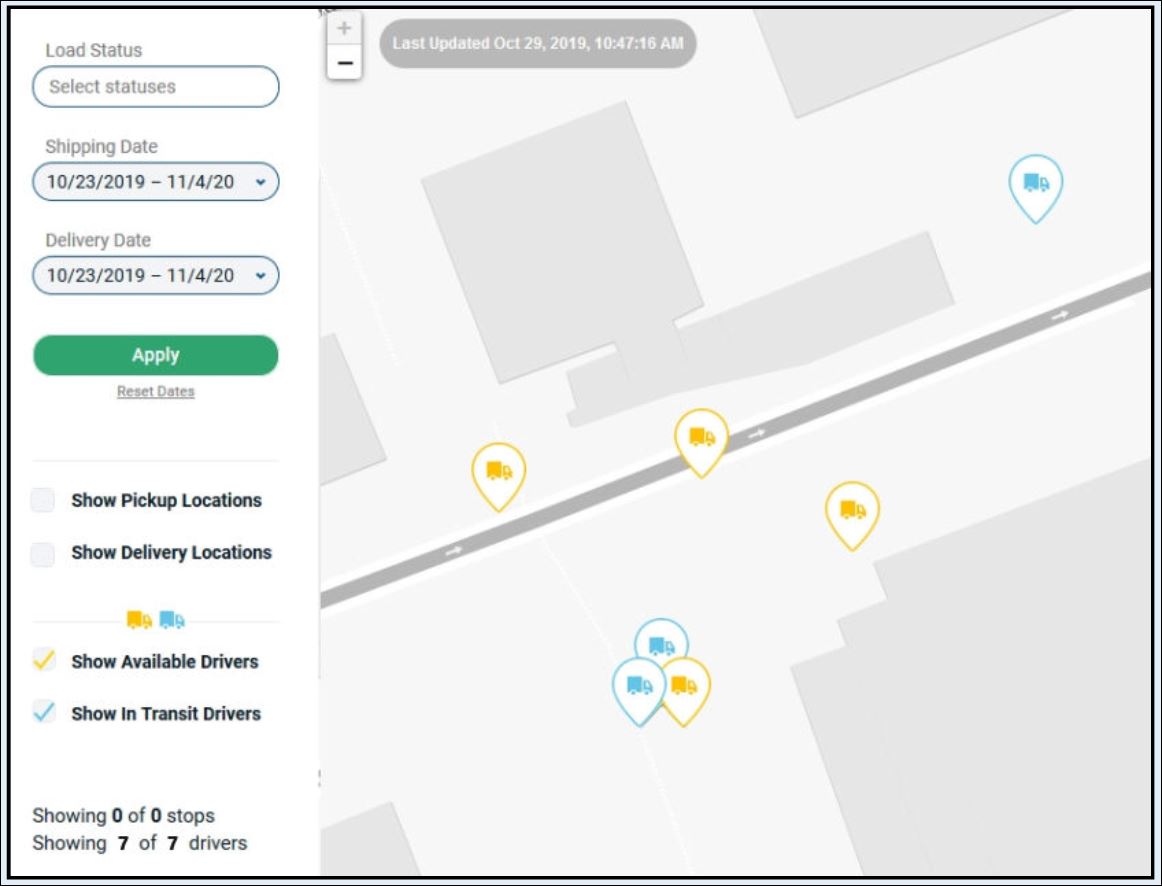
In this example, pickup and delivery locations are hidden. We want to focus on drivers. We can clearly see seven (7) drivers:
-
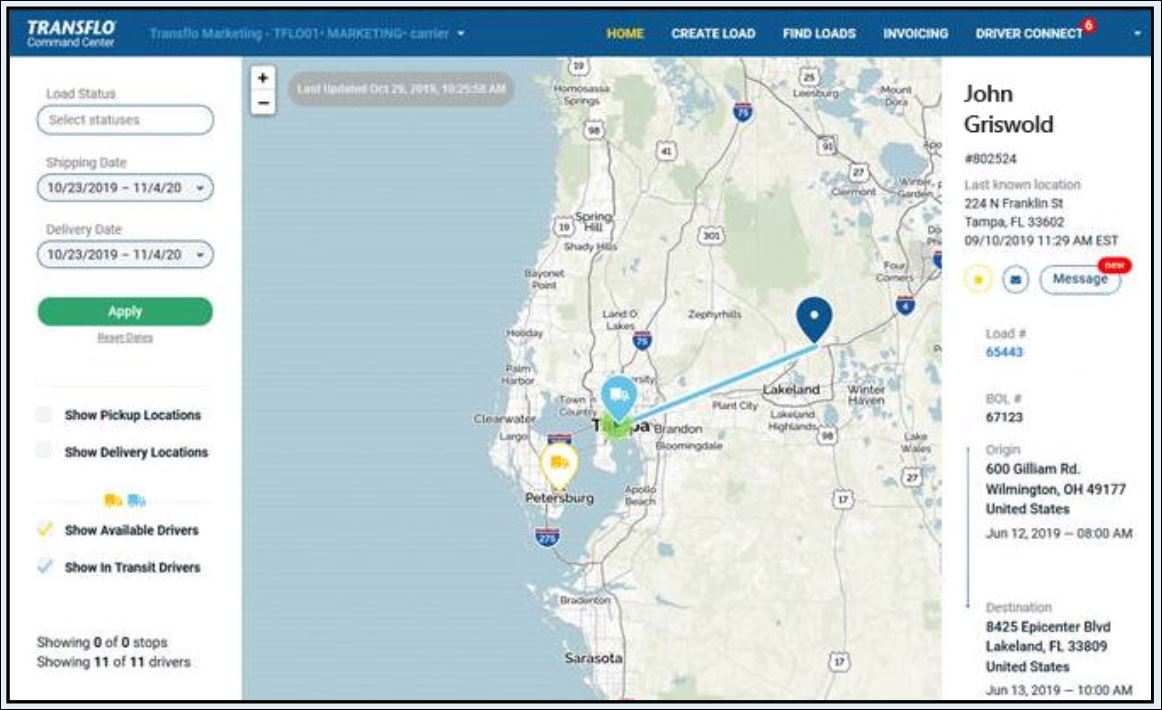
In this example, the user has clicked on the blue driver icon for John Griswold. Driver information appears in the panel on the right side of the screen.
Refer to the load statistics or metrics in this area to answer common questions such as:
-
How many loads from brokers have not been delivered yet?
-
How many new loads are available and simply waiting for driver offers or assignments?
Each load metric appears as a tile or button you can click to view only that subset of loads on the FIND LOADS page.
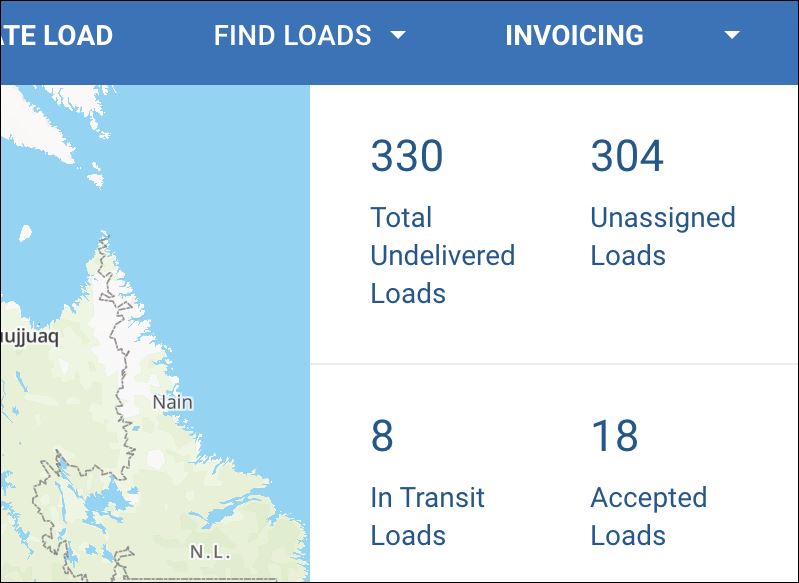
On the right side of the Home screen, brokers see the following clickable links in blue:
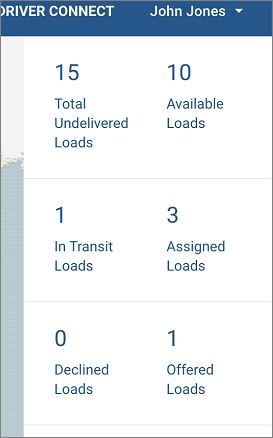
Carriers see the following clickable links in blue:
You can refer to these helpful dynamic options as tiles, metrics, stats, buttons, or links. Click an item to open the associated loads.
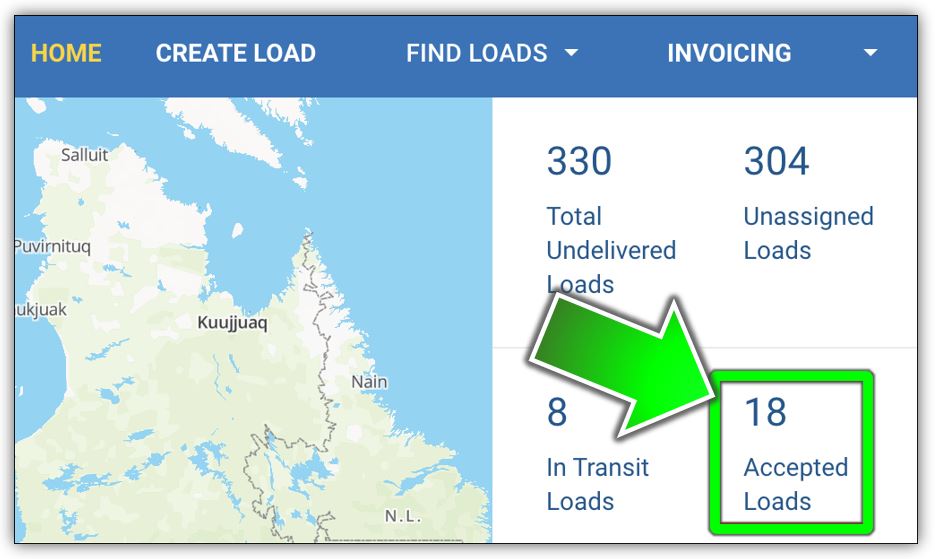
Example: Imagine you are a logistics broker. When you click 18 Accepted Loads, the Loads page opens pre-filtered by status to show you all 18 loads in Accepted status where at least one driver was offered a load and tapped Accept in their Transflo Mobile+ app.
Tip: To go back to the main page with the map, click HOME in the top menu bar.
Total Undelivered Loads: This metric provides a count of all loads that have not been delivered yet. When you click this metric, the Status filter on the FIND LOADS page shows only undelivered loads including available, offered, assigned, accepted, in-transit, and declined loads.
Available Loads: This metric provides a count of the fresh new loads ready for you (as a carrier) to offer or assign to drivers.
-
This number goes up when brokers, carriers, and authorized shippers create new loads.
-
This number goes down as you move these loads to offered, accepted, assigned, in-transit, and eventually delivered status.
In Transit Loads: This metric shows in-transit loads. When a driver swipes Start Load in their mobile app, they are en-route to the shipper and the load status changes from Assigned to InTransit.
Unassigned Loads: For brokers, this metric shows the number of broker loads not yet assigned to a driver. The load might have been offered or it might be new. As a broker, you want to make sure unassigned loads do not remain unassigned as they age.
Accepted Loads: For brokers, this metric shows the number of loads where an offer or assignment has been secured by a driver who has agreed to accept and plan delivery of the load. Accepted loads are still not guaranteed because one or more exposed risks could impact the delivery such as accidents, traffic, or mechanical breakdowns.
Assigned Loads: This metric shows accepted assigned loads. As a dispatcher for a carrier or fleet, compare In Transit loads with Assigned loads. You generally want these metrics to match. In the example below, of the three (3) assigned loads, we see only one (1) in-transit. You can click 3 Assigned Loads and identify the two (2) loads that have not yet started on the FIND LOADS page. Click them to see when they're scheduled to be picked up and contact the driver if he or she is behind schedule. You might need to reassign the load.
Declined Loads: This metric shows the number of loads where all offers were declined by all drivers. As a dispatcher, click this tile to make new offers or reassign these declined loads to available drivers.
Offered Loads: This metric shows the number of loads with at least one current pending offer. After an offer for a load is accepted by a driver, the status of the load switches from Offered to Accepted/Assigned.
Tip: In Velocity+ and the Mobile+ app, the early bird gets the worm! Drivers see their offers in the mobile app. After the first driver accepts a load offer, the remaining drivers no longer see that same load listed as an available offered load.
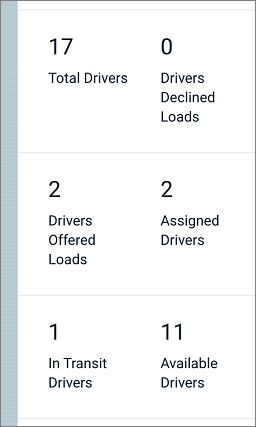
Driver information appears in Transflo Velocity+ Command Center configurations for carriers only. Refer to the driver statistics or metrics in this area to answer common questions such as:
-
How many drivers are currently in-transit?
-
How many total drivers do we have and how many are available now?
In carrier configurations of Transflo Velocity+ Command Center, the following metrics appear in black and are display-only (not clickable):
-
Total Drivers
-
Drivers Declined Loads
-
Drivers Offered Loads
-
Assigned Drivers
-
In Transit Drivers
-
Available Drivers
Total Drivers: A simple count of all drivers who have ever been added. The total includes visible drivers, hidden drivers, and may contain duplicate entries for the same driver. For example, Jack Griswold was added with an old e-mail address and is now hidden. He prefers to go by John Griswold now and is added with a new e-mail address. The system includes 2 entries. Thus, just take note, your system may show 50 Total Drivers for 30 actual named individuals.
Drivers Declined Loads: The number of drivers with an active offer on the table who have declined. Keep an eye on this number. For example, if you sent six (6) new offers today and see this number grow from 4 to 5 to 6 Drivers Declined Loads, you know you need to re-offer the load to other drivers.
Drivers Offered Loads: The number of drivers with an active offer. These drivers can accept, decline, ignore, or otherwise fail to respond to each offer.
Assigned Drivers: The current number of drivers with an active confirmed load assignment. Drivers can be assigned to multiple loads. For example, you might have 6 assigned loads to 4 assigned drivers.
In Transit Drivers: The number of drivers who have acknowledged that they have started an assigned load. As a dispatcher, compare this number with the number of assigned loads. For example, if you have 10 assigned loads but only 7 in-transit drivers, check the load details to find out the scheduled start date and time. If timing is tight, contact the driver about starting the load.
Available Drivers: The number of drivers who are available for new load assignments. To calculate this number, the system starts with the total number of drivers and subtracts assigned drivers and hidden drivers.
![]() View a demonstration of these steps in one or more Transflo videos:
View a demonstration of these steps in one or more Transflo videos:


