Synergize Report Designer
Synergize offers a range of reporting, auditing, and data analysis functions. You can use Synergize Report Designer to create reports for you and other users that can be configured to appear in the Report Viewer Portal.
Note: You or your administrator must install Synergize Portal and the Synergize Report Viewer portlet before you can successfully install Report Designer.
-
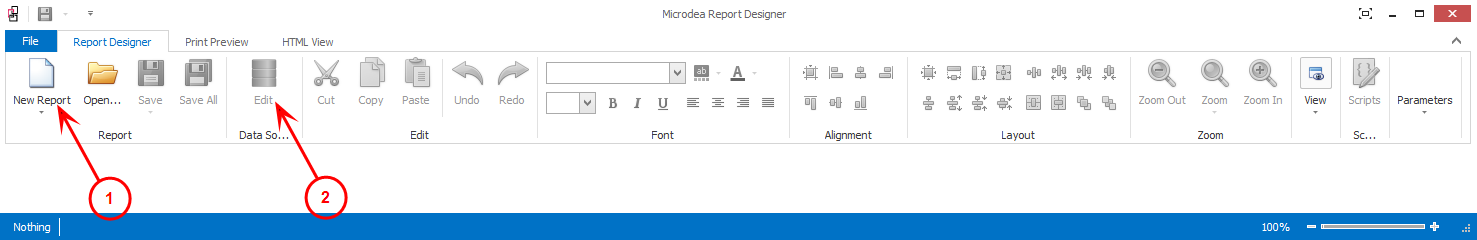
To design your first report, select New Report.
-
Choose a provider. If you are using products like Driver Recruitment, you might see a set of report providers. The default provider is Sql Source.
-
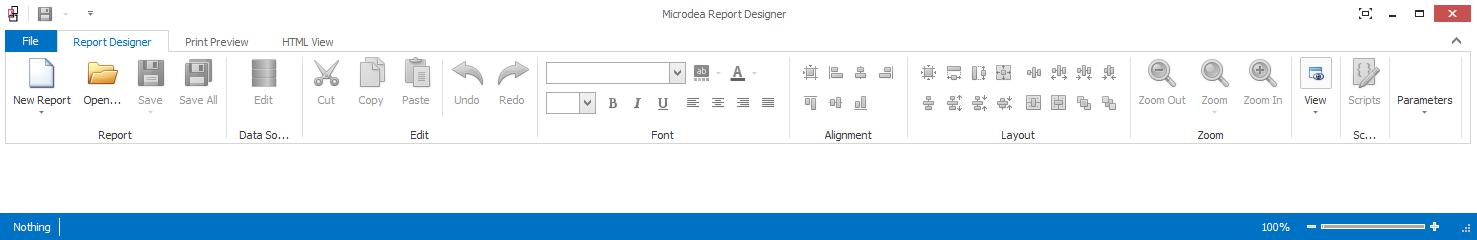
A blank grid appears in the main editing area. By default the name of the report is DataSourceReport.
-
Direct your report to a data source.
Attention Driver Recruitment Users: If you have selected a pre-defined data source provider from the New Report menu, this step is not necessary.
-
Click Edit.
-
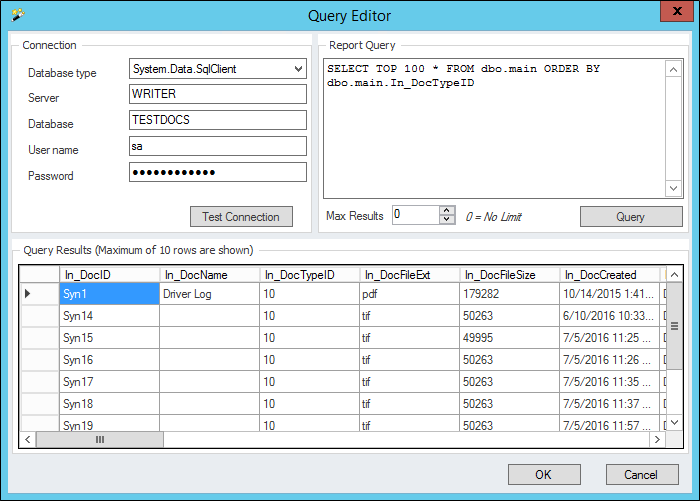
In the Query Editor, specify valid connection information, then type the base SQL query that will be used to populate the available fields and data for the report.
-
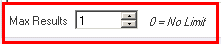
Use the Max Results option to limit your report to the first row or rows to be returned by the query.
-
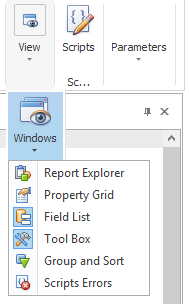
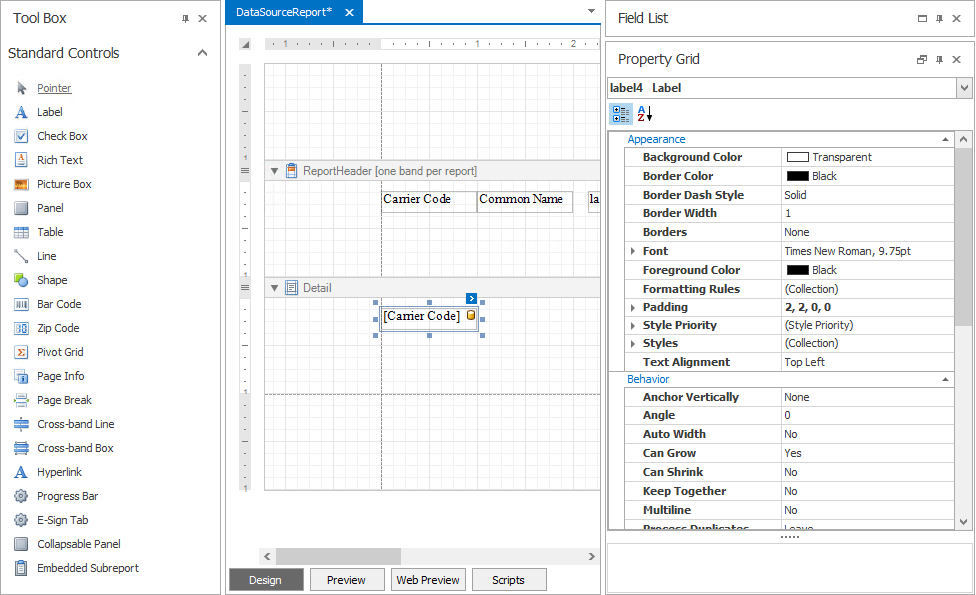
Open the Tool Box to see all the possible elements. The most basic elements are labels. Click View, Windows, Tool Box.
-
Add elements to the report. Add fields from the Field List which will pull the data for that field from each row of the table in the database that matches your data query. You can also define report parameters which are dynamic values that are determined at report generation time and can be acquired by prompting the user running the report.
-
For both labels and fields, drag-and-drop from the appropriate window into the report grid.
-
You can drag the handles on the box to change the size of the displayed item.
-
You can also adjust the look of the label or field by setting its font information.
-
-
To change additional attributes for a label or field, right-click it and select Properties from its shortcut menu.
-
The Property Grid shows information related to any currently selected item.
Example: The following window demonstrates a user editing a report in Report Designer:
Tip: To keep controls on same line or in the same section, place them in a panel so they stick together and do not get clipped at the edges of the report output.
Most of the items in the Report Designer Tool Box are Developer Express controls. See DevExpress 12.2 End-User Documentation starting on page 389 (the link should open on that page).
Links to individual control descriptions are also included in the table below.Most of the controls that represent data can be bound to another data source to make them dynamic.
|
Control Name |
Use |
Provider |
|---|---|---|
|
Pointer |
Do not place any new control. Use for selecting and modifying existing controls on the grid. |
Microdea |
|
Place a text element on the grid. The label can be static or it can be bound to another piece of data that makes it dynamic. |
DevExpress |
|
|
Place a boolean choice box on the grid. By convention if the box is checked it represents TRUE. Unchecked represents FALSE. |
DevExpress |
|
|
Reserve space on the grid for a large amount of formatted text data. |
DevExpress |
|
|
Reserve space on the grid for a graphic image. |
DevExpress |
|
|
Place a container on the grid into which you can place other controls, to keep them grouped together. |
DevExpress |
|
|
Place a display control that uses a row-and-column format to present information. |
DevExpress |
|
|
Place a horizontal or vertical line to visually separate content on the grid. |
DevExpress |
|
|
Place simple graphical objects on the grid. |
DevExpress |
|
|
Convert the control's content into a bar code with the specified symbology and displays it. Several Synergize information capture mechanisms use bar codes to determine information about the document. |
DevExpress |
|
|
Convert the control's content into a zip code, displaying it in standard automated postal processing font. |
DevExpress |
|
|
Represent data dynamically in a cross-tab format, which allows you to see complex data in a compact and summarized manner. |
DevExpress |
|
|
Place a text control containing system information like page number and current date and time. |
DevExpress |
|
|
Place a page delimiter in a report, forcing footers and headers to be produced at that point in the report. |
DevExpress |
|
|
Draw a box around content that crosses several bands in a report. Normally no shape or line can cross bands. |
DevExpress |
|
|
Hyperlink |
A specialized Label that represents a URL. Specify a Navigation URL in the control's property. |
Microdea |
|
Progress Bar |
An experimental control that demonstrates the creation of specialized and extended DevExpress report controls. |
Microdea |
|
E-Sign Tab |
Allow an electronic signature to be entered. |
Microdea |
|
Collapsible Panel |
Reserve a space on the report for a panel that can be toggled between an expanded or collapsed display. |
Microdea |
|
Place another report (as specified in a .repx file) on the grid. |
DevExpress |
-
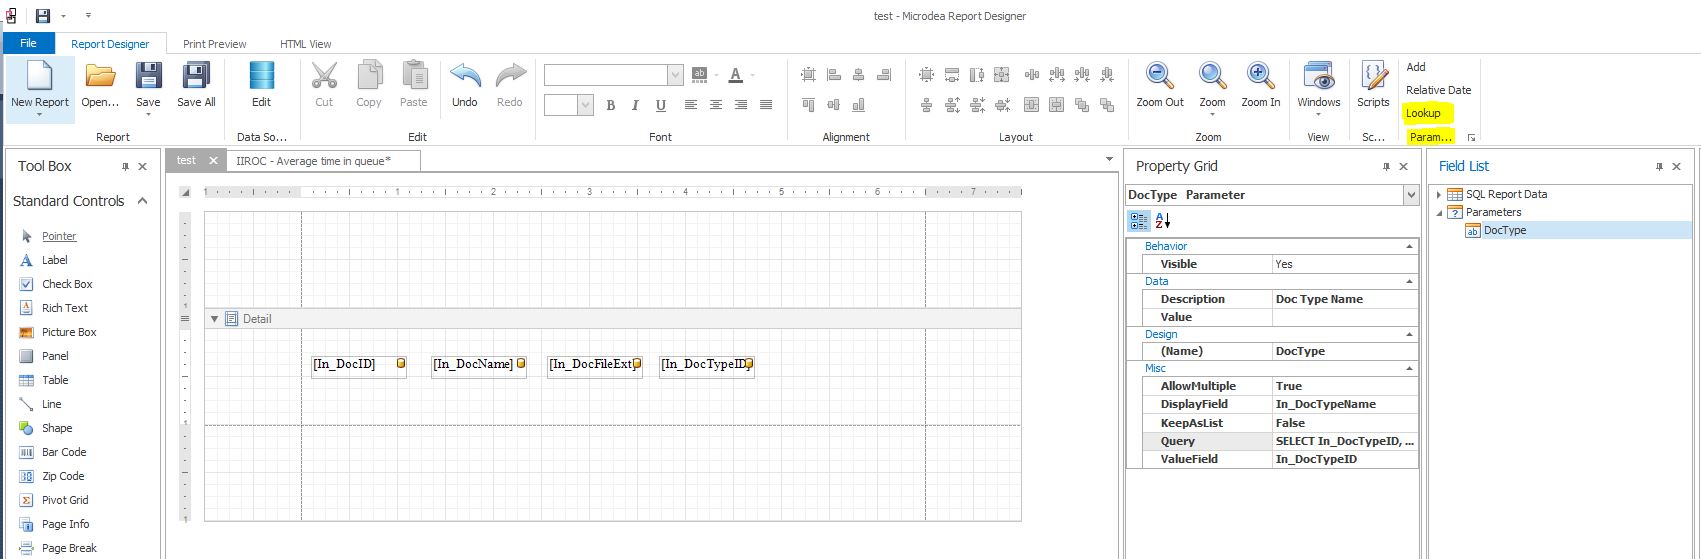
In the toolbar, select the Report Designer tab.
-
In the Parameter section (usually the last section), a Lookup button is available which adds a lookup report parameter.
-
You can set miscellaneous properties like AllowMultiple, DisplayField, KeepAsList, Sql Squery, ValueField and so on after adding the parameter. The new lookup uses the same data source that is set for the report as a whole.
A script can calculate the difference between one timestamp and another. Include the following SQL script then use that in a field that is placed in the footer:
select w1.workflow WF Queue, dt.In_DocTypeName DocumentType,
datediff(ss, wl.DateIn, wl.dateOut) TimeSeconds,
RIGHT ('00000'CAST (datediff(ss, wl.DateIn, wl.dateOut)/3600 as VARCHAR),5) +':'
RIGHT ('00'CAST ((datediff(ss, wl.DateIn, wl.dateOut) % 3600)/60 as VARCHAR),2) +':'
RIGHT ('00'+CAST ((datediff(ss, wl.DateIn, wl.dateOut) % 3600) % 60 as VARCHAR),2) Time In Queue,
RIGHT ('00'+CAST (datediff(ss, wl.DateIn, wl.dateOut) % 60 as VARCHAR),2) secon,
(select SUM(datediff(ss, wl.DateIn, wl.DateOut)) from Main m
inner join WorkflowLog wl on m.In_DocID = wl.DocID
inner join WorkFlow w1 on w1.WorkFlowID$ = wl.FromQueueID
inner join DocTypes dt on m.In_DocTypeID = DT.In_DocTypeID
inner join SynUsers su on wl.UserProcessed = su.UserID
where convert(date, m.In_doccreated,102) between convert(date, @StartDate,102) and
convert(date, @EndDate,102) and Workflow like '%' + 'Agr' + '%'
)
TotalTime
from Main m
inner join WorkflowLog wl on m.In_DocID = wl.DocID
inner join WorkFlow w1 on w1.WorkFlowID$ = wl.FromQueueID
inner join DocTypes dt on m.In_DocTypeID = DT.In_DocTypeID
inner join SynUsers su on wl.UserProcessed = su.UserID
where convert(date, m.In_doccreated,102) between convert(date, @StartDate,102) and
convert(date, @EndDate,102) and Workflow like '%' + 'Agr' + '%'