Productivity Reports for Transflo DMS Users
TRANSFLO® Management Reports includes several Productivity Reports:
-
The Average Processing Time Report displays the average processing time in hours from Origin to Index, Origin to Import and Origin to Rendition Print.
-
The Count by Indexed Document Type Report measures the number of batches and documents processed by TRANSFLO® Capture by Document Type.
-
The Count by Origin/User/Location Report displays batches with page counts broken down by Origin Application, User/Location, and Insert Date/Hour.
-
The Documents Imported But Not Invoiced Report displays imported documents that have not been printed from Rendition Print.
-
The Index User Productivity Report provides details measuring the productivity of TRANSFLO® Capture Users.
-
The Origination Trend by User Report shows the total number of originated documents for a User over time.
-
The Origination/Indexing/Import Report tracks total number of documents Originated, Indexed, and Imported, for a specified date range.
You can view these reports in the Reports menu on the left side of the Management Reports interface. If you cannot see this menu, click Home in the toolbar.
Note: If you are not using the Import application to assign an Import activity to a batch, it is important to ensure that the clocks on the TRANSFLO® Server, and TRANSFLO® Database SQL Server are in sync for the import activity timestamps to appear correctly.
The Average Processing Time Report summarizes the average document processing time from Origination to Indexed, Origination to Import, and Origination to Rendition Print, in a specified date range. These metrics also appear on the Average Processing Time Chart. The Average Processing Time Chart shows average processing time in hours on the y-axis for dates in the date range on the x-axis. A pie chart is also available on this report.
To configure and execute an Average Processing Time Report:
-
In the Reports menu, under Productivity Reports, click Average Processing Time.
-
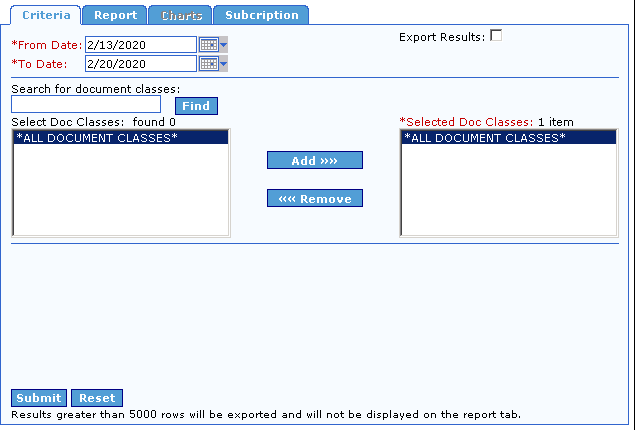
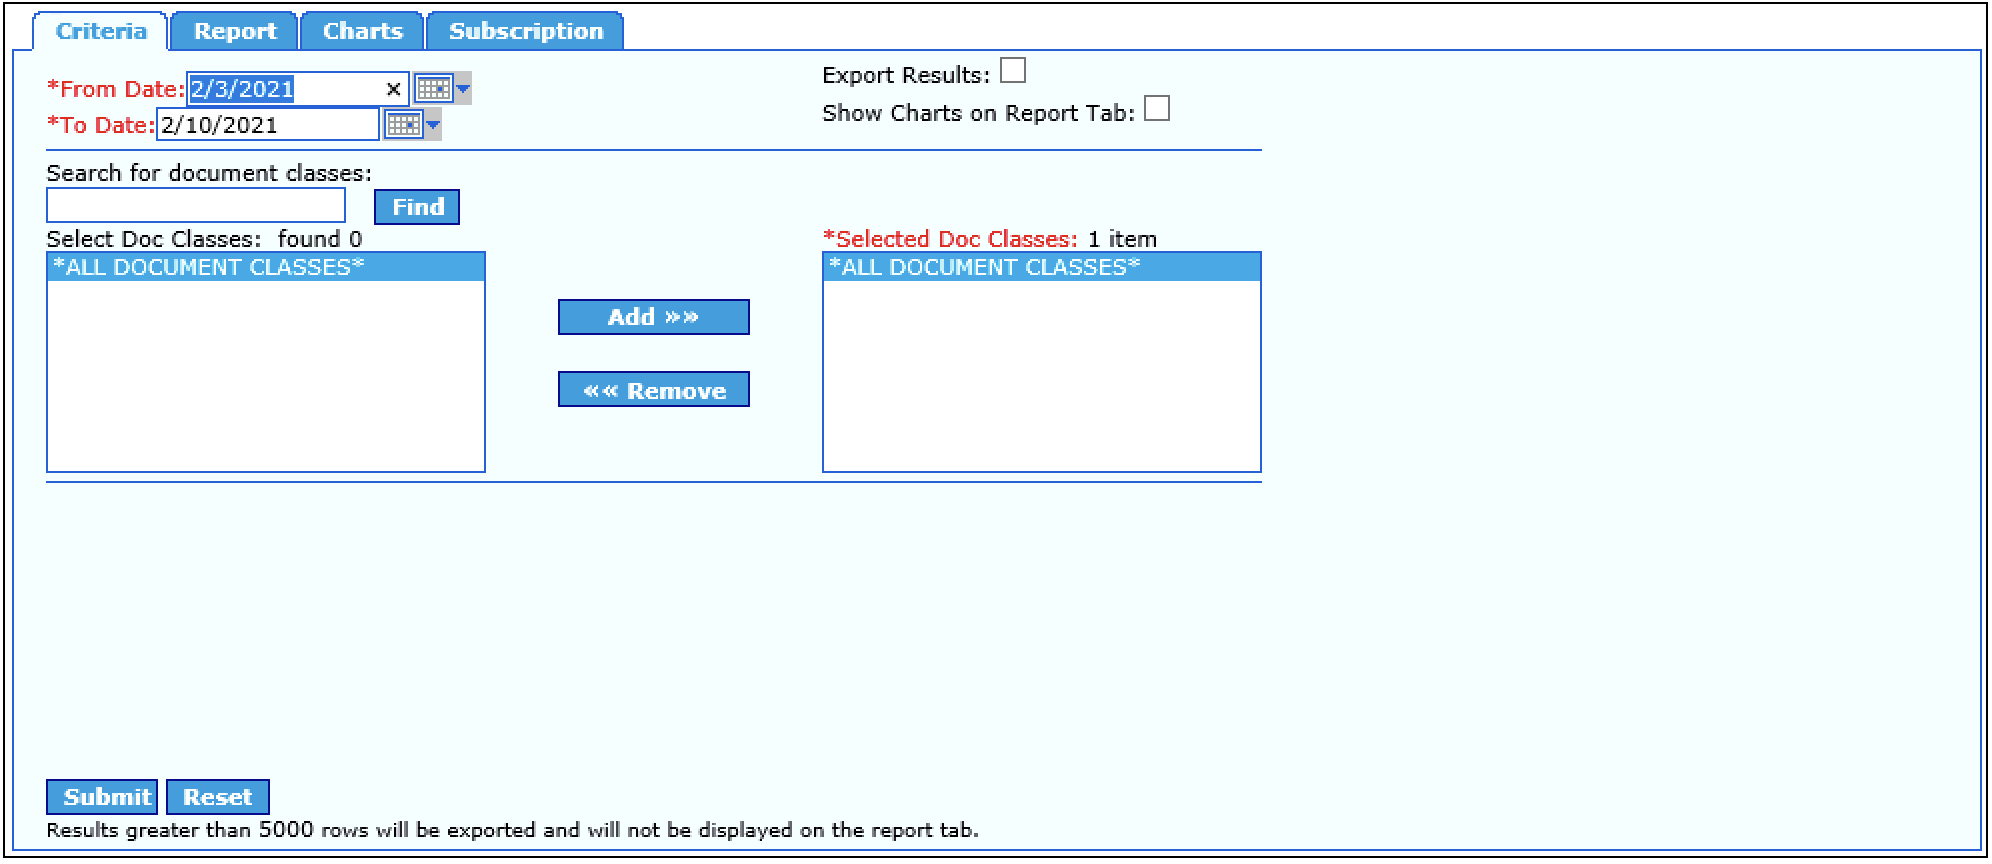
The Average Processing Time interface opens to the Criteria tab.

-
Enter a date range for the report in the From Date and To Date fields. The default date range covers the last seven (7) calendar days.
-
You can delete the default date and enter a new date or click the
 calendar button to the right of each date field and select a date from the pop-up calendar.
 -
To select a date from the calendar, first select the Month and Year for the date. Click the arrow to the left or right of the Month or Year to move the calendar backwards or forwards, until you arrive at the desired month and year.
-
Click the particular Day that you wish to use in the date range. Any Days appearing in gray are in the future and cannot be selected. When you click a Day, the calendar disappears, and the selected date is entered in the corresponding date box.
-
The date in the From Date box must be earlier than that in the To Date box.
-
To restrict the date range to a single day, enter the same date in both fields.
-
-
-
The sole criteria used by the Average Processing Time Report is Document Class. By default, all available Document Class are selected for inclusion in the report. This is shown in the Selected Doc Classes box, which contains the default value *ALL DOCUMENT CLASSES*. To base your report on all Document Class instead of on just a few, it is not necessary to make any changes to the default Document Class settings. To create a report based on only one or a handful of Document Classes, you must first execute a search for the class in the Search for document classes field. Enter search criteria for the desired Document Classes and then click Find or press the [Enter] key. The results of the search are displayed in the Select Doc Classes box.
The basic search string rules are as follows:
String Result *(asterisk)
All available Doc Classes are displayed.
Up to 3 characters, e.g., f, fa, or far
All Doc Classes whose names begin with the entered string are displayed.
For example, the strings f and fa could display the Doc Classesfalcon and family, but the string far would display neither.
More than 3 characters, e.g., east
All Doc Classes whose names contain the string anywhere in the name are returned.
For example, the string east could display the Doc Classeseastern, northeastern, and southeast.
-
After the Document Classes have been added to the Select Doc Classes box, remove the default Document Class from the Selected Doc Classes box. The default selection, *ALL DOCUMENT CLASSES*, already includes the individual Document Classes that were returned by your search. The *ALL DOCUMENT CLASSES* entry is already selected, so to remove it from the Selected Doc Classes box, click the Remove button.
-
Move individual Document Classes to the Selected Doc Classes box. Click the Document Classes in the Select Doc Classes box to select them, and then click the Add button. The Document Classes now appear in the Selected Doc Classes box. To move any of these Document Classes back to the Select Doc Classes box (meaning that they will not be included in the report), click the desired Document Classes to select them, and then click Remove. To select multiple consecutive Document Classes at once, click the first consecutive Document Class to select it, and then click the final consecutive Document Class while holding the [Shift] key. To select multiple non- consecutive Document Classes at once, press and hold the [Ctrl] key while clicking the desired Document Classes.
-
Indicate how you want to view the report data. By default, the data is presented on-screen on the Report tab. However, the option to export the results to spreadsheet format is available. To have the report results generated as a CSV file viewable with most spreadsheet applications, select the Export Results check box, located to the right of the date fields, before running the report.
-
To display the Average Processing Time Chart on the Report tab, select the Show Chart on Report Tab check box. Otherwise, the chart will be displayed only on the Charts tab.
-
Click the Submit button in the bottom-left corner of the Criteria tab.
-
If you selected the Export Results check box, a Windows dialog box appears asking if you would like to open the file or save it. If you click Save, you are prompted to select the folder where you wish to save the CSV file. If you click Open, Windows will attempt to open the CSV file for viewing. You may be required to specify which application Windows should use to open the file.
-
If you did not select the Export Results check box, the Average Processing Time Report tab opens and displays the report in a structured format similar to the one shown below.

-
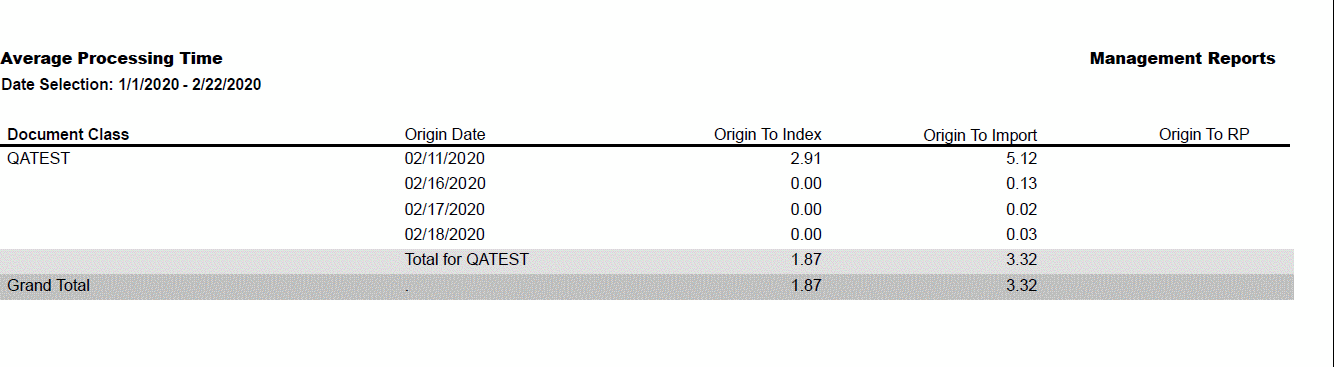
You can also view the report in a printable PDF format. To create a PDF report, click the Printer Friendly (PDF) link on the Report tab. A PDF report similar to the one shown below is created.

-
To print this report, click the Print icon on the Adobe Acrobat Reader toolbar.
-
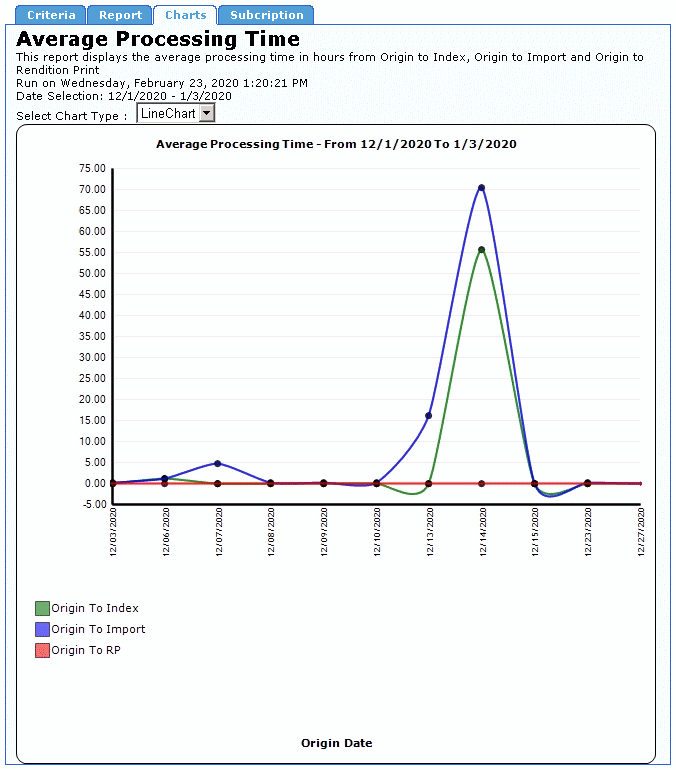
The average document processing time from Origination to Indexed, Origination to Import, and Origination to Rendition Print is also displayed on the Average Processing Time Chart. The Average Processing Time Chart shows average processing time in Hours (on the y-axis) for dates in the date range (on the x- axis). To view the Average Processing Time Chart, click the Charts tab. A chart similar to the one below opens.

If you selected the Show Charts on Report Tab check box on the Criteria tab, the chart also appears on the Report tab.
-
You can also view the data as a pie chart. To do this, expand the Select Chart Type list and click PieChart.
-
To create another Average Processing Time report, click the Criteria tab and configure the date and data type criteria for the new report in the same manner as the previous report. When returning to the Criteria tab after creating a report, all settings from that report are left unchanged to facilitate making small changes to the report criteria. To restore all report criteria to their default settings, click the Reset button, in the bottom-left corner of the tab.
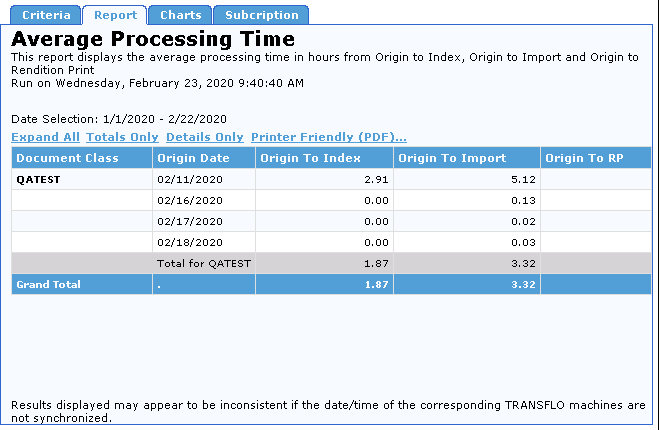
The header of the Average Processing Time Report displays the report title, a description of the report, a time stamp indicating when the report was created, and the dates spanned by the report. The report data is presented in a table with the following columns:
|
Column Heading |
Description |
|---|---|
|
Document Class |
The name of the Doc Class to which the report pertains, or to which this section of the report pertains, if there are multiple Doc Classes in the report. |
|
Date |
The date when processing took place. |
|
Origin >> Index (Hrs) |
The number of hours elapsed from the time the item entered the TRANSFLO® system, until the item was first viewed in Index. |
|
Origin >> Import (Hrs) |
The number of hours elapsed from the time the item entered the TRANSFLO® system, until the item was imported. |
|
Origin >> RP (Hrs) |
The number of hours elapsed from the time the item entered the TRANSFLO® system, until a Rendition Print form (typically an invoice) is generated. |
The Average Processing Time Report contains rows displaying column totals for each Document Class individually and for all represented Document Classes as a whole. These rows are described below.
|
Row Title |
Description |
|---|---|
|
Total for <DocClass> |
The average of all rows for a specific Doc Class. |
|
Grand Total |
The average of all rows for all Doc Classes. |
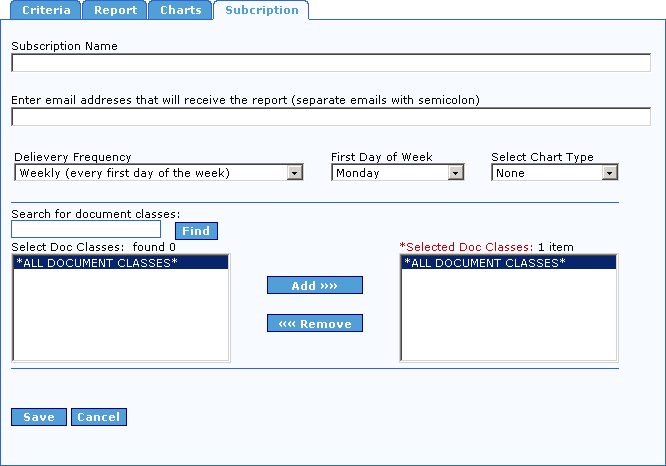
To create an Average Processing Time Report Subscription:
1. Click the Subscription tab.

2. Click the Add button.
The Add Subscription form for the Average Processing Time Report opens.
Note: This same form opens when you click the Edit button on the Subscription tab.
3. Enter a name for your report subscription in the Subscription Name box.
4. Enter the list of email addresses separated by semicolons (;) where you would like this report to be sent in the Enter email addresses that will receive the report (separate emails with semicolon) box.
5. Select how often you would like this report to be delivered from the Delivery Frequency drop-down.
Your options are Daily, Weekly, and Monthly.
If you choose Daily, the report will be sent every day with data from the previous day.
If you choose Monthly, the report will be sent the first day of every month for the previous month.
6. If you selected Weekly from the Delivery Frequency drop-down, the First Day of the Week drop-down is visible.
Select the day of the week you would like the report to be emailed from the First Day of the Week drop-down.
The report will be for the previous week.
7. If you would like to send a Chart with each Report Subscription email, select either LineChart, PieChart, or Both, from the Select Chart Type drop-down list.
Otherwise, select None.
8. Select the Document Classes for the report as described in Interpret an Average Processing Time Report.
9. To save the report subscription, click the Save button, otherwise click the Cancel button.
The report subscription is added to the Subscription list.
10. To delete a subscription from the list, select it and click the Delete button.
You will not be prompted to confirm you want to delete the subscription.
11. To update your list, click the Refresh button.
The Count by Indexed Document Type Report measures the number of processed documents, arranged by Indexed Document Type.
To configure and execute a Count by Indexed Document Type Report:
1. On the reports menu, under the Productivity Reports heading, click Count by Indexed Document Type.
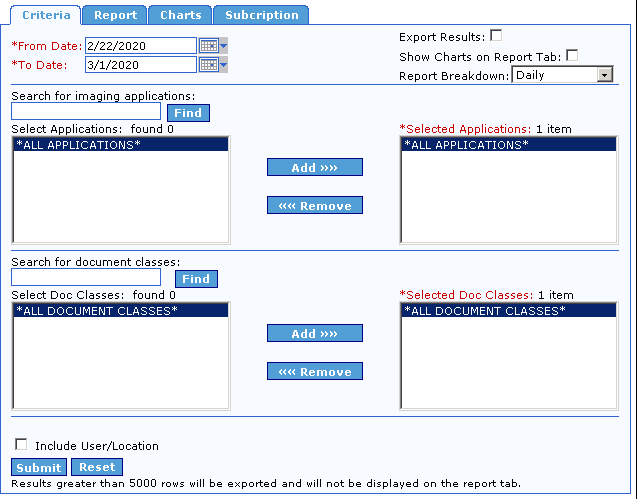
2. The Count by Indexed Document Type interface opens to the Criteria tab.
3. Begin configuring the Count by Indexed Document Type Report, by entering the date range for the report.
The default date range spans backwards seven calendar days from the previous day’s date.
If the default date range is not the desired range, enter the desired dates in the From Date and To Date boxes.
To do this, click in the appropriate box, delete the default date, and type a new date, or click the calendar button to the right of the box and select the date from the pop-up calendar that appears.
To select a date from the calendar, first select the Month and Year for the date.
Click the arrow to the left or right of the Month or Year to move the calendar backwards or forwards, until you arrive at the desired month and year.
Next, click the particular Day that you wish to use in the date range.
Any Days appearing in gray are in the future and cannot be selected.
When you click a Day, the calendar disappears, and the selected date is entered in the corresponding date box.
Note: The date in the From Date box must be earlier than that in the To Date box.
To restrict the date range to a single Day, enter the same date in both boxes.
4. The sole criteria used by the Count by Indexed Document Type Report is Document Class.
By default, all available Document Class are selected for inclusion in the report.
This is shown in the Selected Doc Classes box, which contains the default value *ALL DOCUMENT CLASSES*.
To base your report on all Document Class instead of on just a few, it is not necessary to make any changes to the default Document Class settings.
If, however, you wish to create a report based on only one or a handful of Document Classes, you must first execute a search for the desired Document Class.
This is easily done via the Search for document classes box.
In this box, enter search criteria for the desired Document Classes, and then click Find or press the [Enter] key.
The results of the search are displayed in the Select Doc Classes box.
The basic search string rules are as follows:
| String | Result |
|---|---|
|
*(asterisk) |
All available Doc Classes are displayed. |
|
Up to 3 characters, e.g., f, fa, or far |
All Doc Classes whose names begin with the entered string are displayed. For example, the strings f and fa could display the Doc Classesfalcon and family, but the string far would display neither. |
|
More than 3 characters, e.g., east |
All Doc Classes whose names contain the string anywhere in the name are returned. For example, the string east could display the Doc Classeseastern, northeastern, and southeast. |
5. After the desired Document Classes have been added to the Select Doc Classes box, the next step before generating a report is to remove the default Document Class from the Selected Doc Classes box.
This is because the default selection, *ALL DOCUMENT CLASSES*, already includes the individual Document Classes that were returned by your search.
The *ALL DOCUMENT CLASSES* entry is already selected.
To remove it from the Selected Doc Classes box, click the Remove button.
6. Now move the individual Document Classes to the Selected Doc Classes box.
To do this, click the desired Document Classes in the Select Doc Classes box to select them, and then click the Add button.
The Document Classes now appear in the Selected Doc Classes box.
To move any of these Document Classes back to the Select Doc Classes box (meaning that they will not be included in the report), click the desired Document Classes to select them, and then click Remove.
Note: To select multiple consecutive Document Classes at once, click the first consecutive Document Class to select it, and then click the final consecutive Document Class while holding the [Shift] key.
To select multiple non- consecutive Document Classes at once, press and hold the [Ctrl] key while clicking the desired Document Classes.
7. You are almost ready to generate the Count by Indexed Document Type Report.
The last step before doing so is to indicate how you want to view the report data.
By default, the data is presented on-screen on the Report tab.
However, the option to export the results to spreadsheet format is available.
To have the report results generated as a CSV file viewable with most spreadsheet applications, select the Export Results check box, located to the right of the date fields, before running the report.
8. When you are ready to generate the Count by Indexed Document Type Report, click the Submit button in the bottom-left corner of the Criteria tab.
If you selected the Export Results check box, a Windows dialog box appears asking if you would like to open the file or save it.
If you click Save, you are prompted to select the folder where you wish to save the CSV file.
If you click Open, Windows will attempt to open the CSV file for viewing.
You may be required to specify which application Windows should use to open the file.
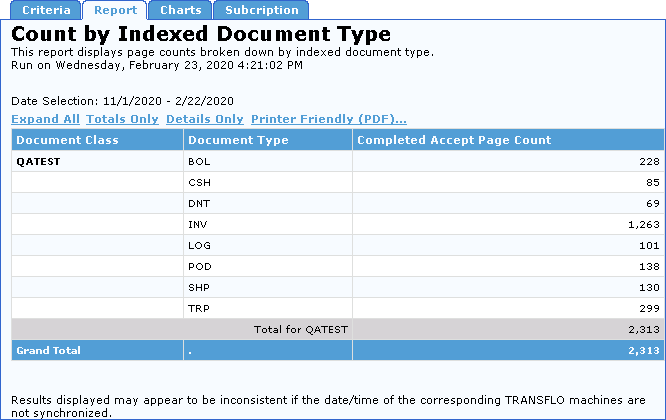
9. If you did not select the Export Results check box, the Count by Indexed Document Type Report tab appears and displays the report in a structured format similar to the one shown below.
10. Regardless of whether or not you elected to have the report exported to CSV format, you may also view the report in a printable PDF format.
To create a PDF report, click the Printer Friendly (PDF) link on the Report tab.
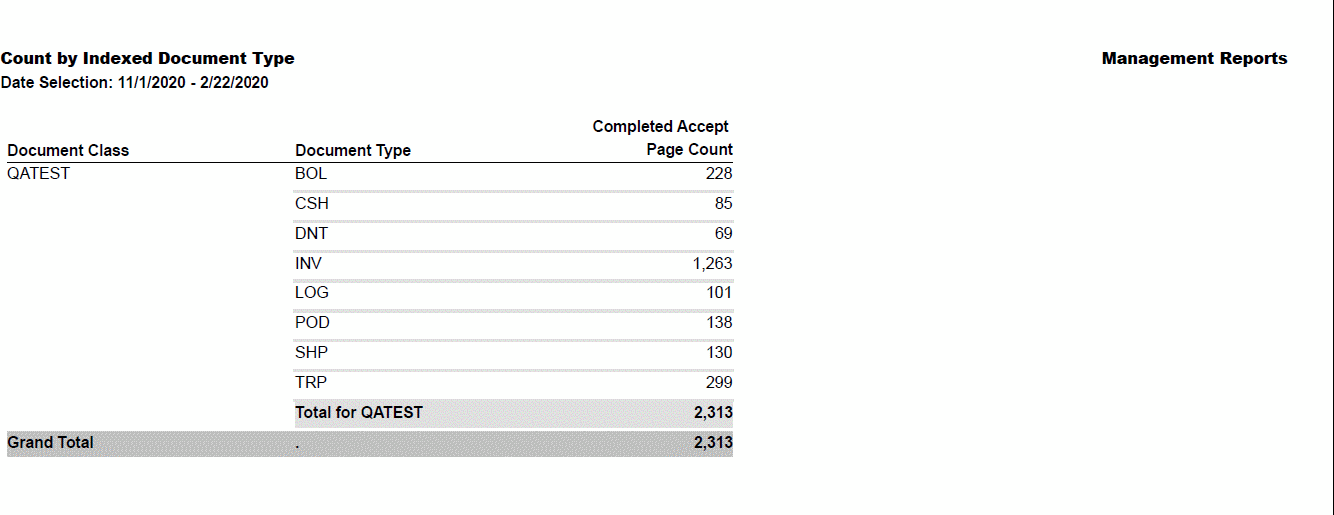
To print this report, click the Print icon on the Adobe Acrobat Reader toolbar.
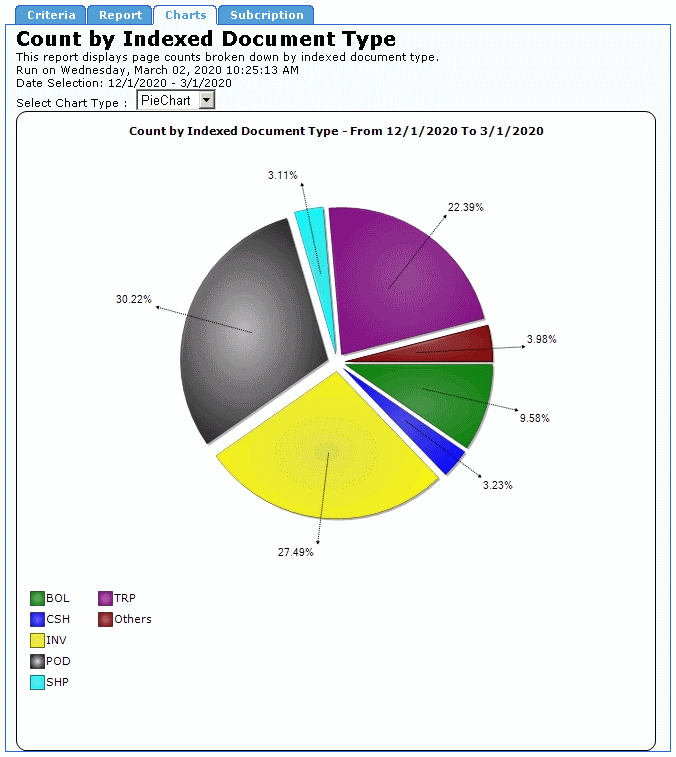
11. To view the Count by Indexed Document Type chart, click the Charts tab.
A pie chart showing the percentage of each Document Type that was indexed in the time frame set on the Criteria tab for the selected Document Classes.
To view a line chart with actual counts by Document Type select LineChart from the Select Chart Type drop-down.
12. To create another Count by Indexed Document Type Report, click the Criteria tab and configure the date and data type criteria for the new report, in the same manner as the previous report.
When returning to the Criteria tab after creating a report, all settings from that report are left unchanged to facilitate making small changes to the report criteria.
To restore all report criteria to their default settings, click the Reset button, in the bottom-left corner of the tab.
The header of the Count by Indexed Document Type Report displays the report title, a description of the report, a time stamp indicating when the report was created, and the dates spanned by the report. The report data is presented in a table. The columns and rows of this table are described below.
|
Column Heading |
Description |
|---|---|
|
Document Class |
The name of the Doc Class to which the report pertains, or to which this section of the report pertains, if there are multiple Doc Classes in the report. |
|
Document Type |
The name of the Indexed Document Type to which the report pertains, or to which this section of the report pertains, if there are multiple Indexed Document Types in the report. |
|
Completed Accept Page Count |
The number of completed pages accepted by TRANSFLO® Index that were of the corresponding Indexed Document Type. The Grand Total row displays the total number of accepted completed pages for this report. |
The Count by Indexed Document Type Report contains rows displaying column totals for each Document Class individually and for all represented Document Classes as a whole.
These rows are described below.
|
Row Title |
Description |
|---|---|
|
Total for <DocClass> |
The sum total of all rows in the Completed Accept Page Count column for a specific Doc Class. |
|
Grand Total |
The sum total of all rows in the Completed Accept Page Count column for all Doc Classes. |
To create a Count by Indexed Document Type Report Subscription:
1. Click the Subscription tab.
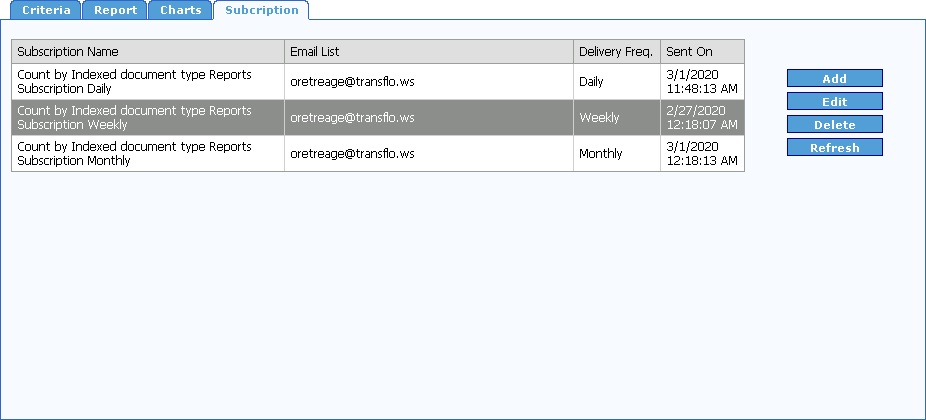
2. Click the Add button.
The Add Subscription form for the Count by Indexed Document Type Report opens.
Note: This same form opens when you click the Edit button on the Subscription tab.
3. Enter a name for your report subscription in the Subscription Name box.
4. Enter the list of email addresses separated by semicolons (;) where you would like this report to be sent in the Enter email addresses that will receive the report (separate emails with semicolon) box.
5. Select how often you would like this report to be delivered from the Delivery Frequency drop-down.
Your options are Daily, Weekly, and Monthly.
If you choose Daily, the report will be sent every day with data from the previous day.
If you choose Monthly, the report will be sent the first day of every month for the previous month.
6. If you selected Weekly from the Delivery Frequency drop-down, the First Day of the Week drop-down is visible.
Select the day of the week you would like the report to be emailed from the First Day of the Week drop-down.
The report will be for the previous week.
7. If you would like to send a Charts with each Report Subscription email, select either LineChart, PieChart, or Both, from the Select Chart Type drop-down list.
Otherwise, select None.
8. Select the Document Classes for the report as described in Create a Count by Indexed Document Type Report.
9. To save the report subscription click the Save button, otherwise click the Cancel button.
The report subscription is added to the Subscription list.
10. To delete a subscription from the list, select it and click the Delete button.
You will not be prompted to confirm you want to delete the subscription.
11. To update your list, click the Refresh button.
The Count by Origin/User/Location Report measures the number of processed Batches and Documents, displayed by Origin Application and Insert Date.
Additionally, this report can be narrowed down by User ID or Location ID, if so desired.
This report contains Trend Charts that display the document origination trends by the relevant applications over the date range entered on the Criteria tab.
The Trend Chart shows document count levels (on the y-axis) for dates in the selected date range (on the x-axis).
A Pie Chart is also available showing a comparison of documents originated by each application.
To configure and execute a Count by Origin/User/Location Report:
1. On the reports menu, under the Productivity Reports heading, click Count by Origin/User/Location.
The Count by Origin/User/Location interface opens to the Criteria tab.
2. A Count by Origin/User/Location Report can be created either for a range of dates with report data displayed by day, or for a single date with report data displayed by hour.
When creating an Index User Productivity Report, first decide which of these two options will be used.
This setting is configured via the Report Breakdown list, in the top-right portion of the Criteria tab which contains two settings, Daily and Hourly, with the default setting being Daily.
If you prefer to have the report display an hourly breakdown for a single day, expand the list and click Hourly.
Next, select the date range if you are configuring a daily report breakdown, or the single date if you are configuring an hourly report breakdown.
For a daily report breakdown, enter the dates in the text boxes provided.
The default date range spans backwards seven calendar days from the previous day’s date.
If the default date range is not the desired range, enter the desired dates in the From Date and To Date boxes.
To do this, click in the appropriate box, delete the default date, and type a new date; alternatively, you can click the calendar button to the right of the date box and select a new date from the pop-up calendar.
To select a date from the calendar, first select the Month and Year for the date.
Click the arrow to the left or right of the Month or Year to move the calendar backwards or forwards until you arrive at the desired Month and Year.
Next, click the particular Day that you wish to use in the date range.
Any days appearing in gray are in the future and cannot be selected.
When you click a Day, the calendar disappears and the selected date is entered in the corresponding date box.
Note: The date in the From Date box must be earlier than that in the To Date box.
To restrict the date range to a single Day, enter the same date in both boxes.
For an hourly report breakdown, enter the report date in the box provided.
By default, hourly reports are based on the previous day’s date.
To base the report on a different date, enter that date in the Date box either by typing it or by clicking the calendar button and selecting a date from the pop-up calendar.
On the Criteria tab, you are required to configure the TRANSFLO® Imaging Applications used in creating the Count by Origin/User/Location Report.
To base your report on all Imaging Applications instead of on just a few, it is not necessary to make any changes to the default Application settings.
If, however, you wish to create a report based on only one or a handful of Applications, you must first execute a search for the desired Applications.
Enter the search criteria for the desired Imaging Applications in the Search for imaging applications box.
Click Find or press the [Enter] key.
The results of the search are displayed in the Search for imaging applications box.
The basic search string rules are as follows:
| String | Result |
|---|---|
|
*(asterisk) |
All available Applications are displayed. |
|
Up to 3 characters, e.g., f, fa, or far |
All Applications whose names begin with the entered string are displayed. For example, the strings f and fa could display the Applicationsfallison and fanderson, but the string far would display neither. |
|
More than 3 characters, e.g., east |
All Applications whose names contain the string anywhere in the name are returned. For example, the string east could display the Applicationseastin, jeastman, and rweast. |
After the desired Applications have been added to the Select Applications box, the next step, before generating a report is to remove the default selection from the Selected Applications box.
This is because the default selection,
*ALL APPLICATIONS*, already includes the individual Applications that were returned by your search.
The *ALL APPLICATIONS* entry is already selected, so to remove it from the Selected Applications box, simply click the Remove button.
3. Now you can move individual Applications to the Selected Applications box.
To do this, click the desired Applications in the Select Applications box to select them, and then click the Add button.
The Applications now appear in the Selected Applications box.
To move any of these Applications back to the Select Applications box (meaning that they will not be included in the report), click the desired Applications to select them, and then click Remove.
Note: To select multiple consecutive Applications at once, click the first consecutive Application to select it, and then click the final consecutive Application while holding the [Shift] key.
To select multiple non-consecutive Applications at once, press and hold the [Ctrl] key while clicking the desired Applications.
4. Next, select which Document Classes should be included in the report.
The procedure for doing this is identical to the procedure for selecting Applications.
To base your report on all Document Classes instead of on only one or a few, it is not necessary to make any changes to the default Document Class settings.
5. Optionally, you may further refine your report results by User.
To do this, expand the Criteria tab by selecting the Include User/Location check box just below the Document Class search criteria section.
To add Users to your search criteria, select which Users should be included in the report.
The procedure for doing this is identical to the procedure for selecting Applications or Document Classes.
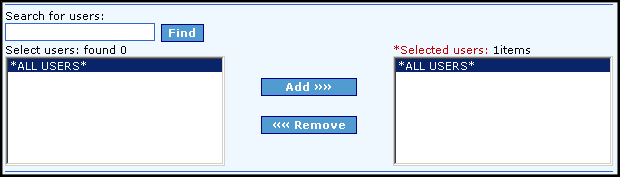
To base your report on all Users instead of on only one or a few, it is not necessary to use this feature since All Users is the default.
6. To display the Count by Origin/User/Location Chart on the Report tab, select the Show Chart on Report Tab check box before running the report.
7. You are almost ready to generate the Count by Origin/User/Location Report.
The last step before doing so is to indicate how you want to view the report data.
By default, the data is presented on-screen on the Report tab.
However, the option to export the results to spreadsheet format is available.
To have the report results generated as a CSV file viewable with most spreadsheet applications, select the Export Results check box, located to the right of the date fields, before running the report.
8. When you are ready to generate the Count by Origin/User/Location Report, click the Submit button.
If you selected the Export Results check box, a Windows dialog box appears asking if you would like to open the file or save it.
If you click Save, you are prompted to select the folder where you wish to save the CSV file.
If you click Open, Windows will attempt to open the CSV file for viewing.
You may be required to specify which application Windows should use to open the file.
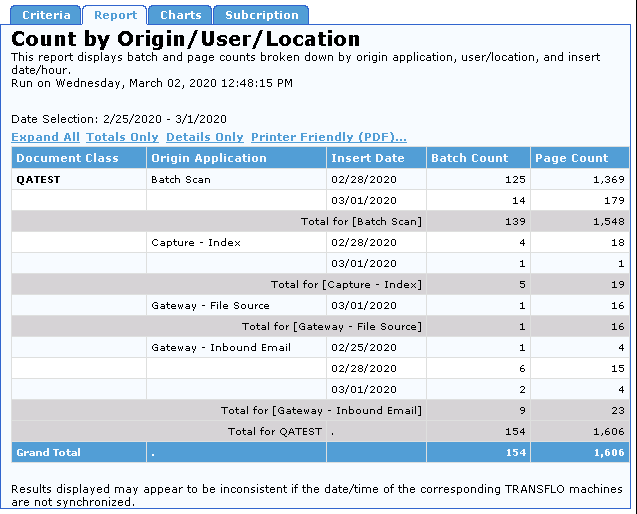
If you did not select the Export Results check box, the Report tab opens showing the report.
9. Regardless of whether or not you elected to have the report exported in CSV format, you can also view the report in a printable PDF format.
To create a PDF report, click the Printer Friendly (PDF) link on the Report tab.
A PDF report similar to the one shown below appears.
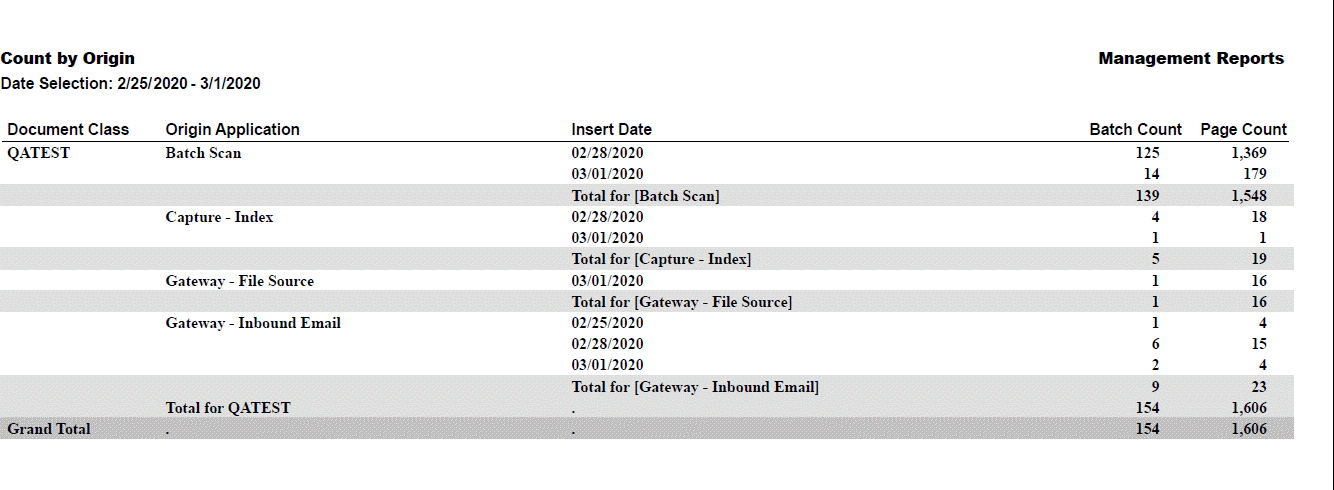
To print this report, click the Print button on the Adobe Acrobat Reader toolbar.
10. This report contains Trend Charts that display the document origination trends by the relevant applications over the date range entered on the Criteria tab.
The Trend Chart shows count levels (on the y-axis) for dates in the date range (on the x-axis).
To view this chart, click on the Charts tab.
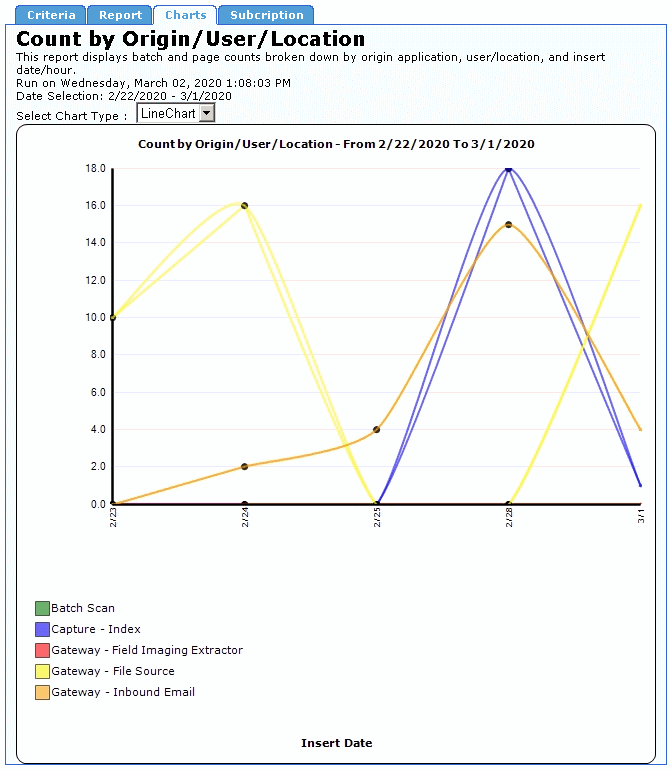
11. A Pie Chart is also available showing a comparison of documents originated by each application.
To view the Pie Chart, expand the Select Chart Type list and click PieChart.
12. To create another Count by Origin/User/Location Report, click the Criteria tab and configure the date and data type criteria for the new report in a similar manner as the previous report.
When returning to the Criteria tab after creating a report, all settings from that report are left unchanged to facilitate making small changes to the report criteria.
To restore all report criteria to their default settings, click the Reset button, in the bottom-left corner of the tab.
The header to the Count by Origin/User/Location Report displays the report title, a description of the report, a time stamp indicating when the report was created, and the dates spanned by the report. The report data is presented in a table. The columns and rows of this table are described below.
|
Column Heading |
Description |
|---|---|
|
Document Class |
The name of the Doc Class to which the report pertains, or to which this section of the report pertains, if there are multiple Doc Classes in the report. |
|
Origin Application |
The name of the Origin Application to which the report pertains, or to which this section of the report pertains, if there are multiple Origin Applications in the report. |
|
User ID / Location ID |
If the source is Batch Scan, this column displays the ID of the user that scanned the Batches. If the source is TFX, Terminal Scan, or Trip Pack, this column displays the Location ID indicating where the batch was scanned. |
|
Insert Date * Daily Report Breakdown only |
The date on which the Batches represented in this row were inserted into the reporting database. |
|
Insert Hour * Hourly Report Breakdown only |
The hour in which the Batches represented in this row were inserted into the reporting database. |
|
Batch Count |
The number of Batches that originated with the corresponding Origin Application for the indicated User or Location.The Grand Total row displays the total number of Batches that originated with all Applications in the report. |
|
Page Count |
The total number of pages included in the Batches that originated with the corresponding Origin Application. The Grand Total row displays the total number of pages included in all Batches in the report. |
The Count by Origin/User/Location Report contains rows displaying column totals for each Document Class individually and for all represented Document Classes as a whole.
These rows are described below.
|
Row Title |
Description |
|---|---|
|
Total for <OriginApp> |
The sum total of all rows in the Batch Count and Page Count columns for a specific Origin Application. |
|
Total for <User> |
The sum total of all rows in the Batch Count and Page Count columns for a specific user. |
|
Total for <DocClass> |
The sum total of all rows in the Batch Count and Page Count columns for a specific Doc Class. |
|
Grand Total |
The sum total of all rows in the Batch Count and Page Count columns for all Doc Classes. |
To create a Count by Origin/User/Location Report Subscription:
1. Click the Subscription tab.
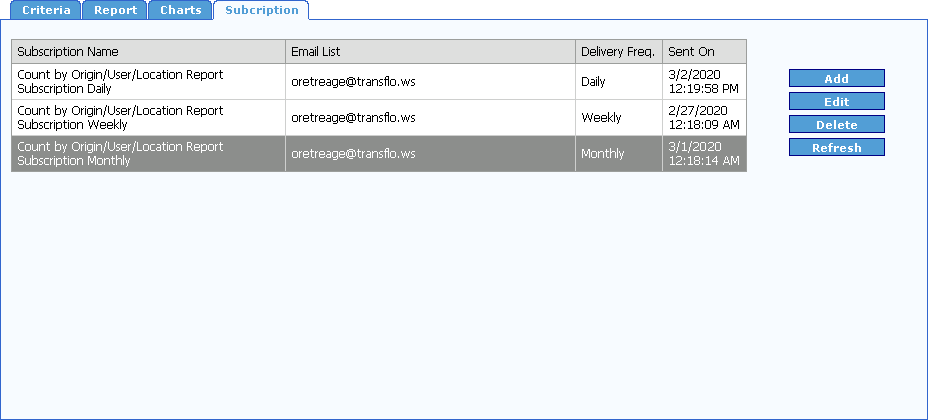
2. Click the Add button.
The Add Subscription form for the Count by Origin/User/Location Report opens.
Note: This same form opens when you click the Edit button on the Subscription tab.
3. Enter a name for your report subscription in the Subscription Name box.
4. Enter the list of email addresses separated by semicolons (;) where you would like this report to be sent in the Enter email addresses that will receive the report (separate emails with semicolon) box.
5. Select how often you would like this report to be delivered from the Delivery Frequency drop-down.
Your options are Daily, Weekly, and Monthly.
If you choose Daily, the report will be sent every day with data from the previous day, and the report will show an hourly breakdown.
If you choose Monthly, the report will be sent the first day of every month for the previous month, and the report will show a daily breakdown.
6. If you selected Weekly from the Delivery Frequency drop-down, the First Day of the Week drop-down is visible.
Select the day of the week you would like the report to be emailed from the First Day of the Week drop-down.
The report will be for the previous week, the report will show a daily breakdown.
7. Select imaging applications, Document Classes, and optionally Users and Locations in the same manner as described in Create a Count by Origin/User/Location Report.
8. To save the report subscription click the Save button, otherwise click the Cancel button.
9. The report subscription is added to the Subscription list.
10. To delete a subscription from the list, select it and click the Delete button.
You will not be prompted to confirm you want to delete the subscription.
11. To update your list, click the Refresh button.
The Documents Imported But Not Invoiced Report returns a list of uniquely keyed documents that have been Imported into the imaging system, but not Invoiced from TRANSFLO® Rendition Print. To configure the report, you must select a start date (From Date), an Exclusion Period, and a Document Class. Documents that are imported on or after the Import date, and were not printed from Rendition Print (minus the Exclusion Period specified), will be listed on the report.
To configure and execute a Documents Imported But Not Invoiced Report:
1. On the Reports menu, under the Productivity Reports heading, click Imported but not Invoiced.
The Documents Imported But Not Invoiced interface opens to the Criteria tab.
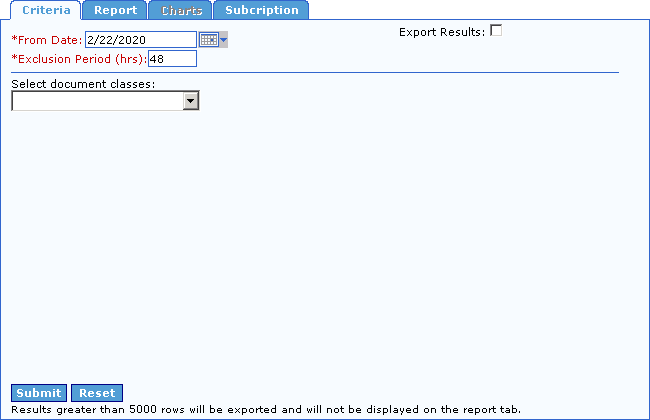
2. Begin configuring the Documents Imported But Not Invoiced Report, by entering the beginning date for the report in the From Date box.
To do this, click in the box, delete the default date, and type a new date, or click the calendar button to the right of the box and select the date from the pop-up calendar that appears.
To select a date from the calendar, first select the Month and Year for the date.
Click the arrow to the left or right of the Month or Year to move the calendar backwards or forwards, until you arrive at the desired Month and Year.
Next, click the particular Day that you wish to use in the date range.
Any Days appearing in gray are in the future and cannot be selected.
When you click a Day, the calendar disappears and the selected date is entered in the corresponding date box.
Note: The date in the From Date box must be the current date or a date prior to the current date.
3. Next, enter the number of hours of the Exclusion Period for the report in the Exclusion Period (hrs) box.
The Exclusion Period describes the amount of time it normally takes for documents to be invoiced, so this field allows you to exclude a period of time for which the documents are knowingly not invoiced.
4. Expand the Select document classes list and click the name of the Document Class that should be used for this report.
5. You are almost ready to generate the Documents Imported But Not Invoiced Report.
The last step before doing so is to indicate how you want to view the report data.
By default, the data is presented on-screen on the Report tab.
However, the option to export the results to spreadsheet format is available.
To have the report results generated as a CSV file viewable with most spreadsheet applications, select the Export Results check box, located to the right of the date fields, before running the report.
6. When you are ready to generate the Documents Imported But Not Invoiced Report, click the Submit button, in the bottom-left corner of the Criteria tab.
If you selected the Export Results check box, a Windows dialog box appears asking if you would like to open the file or save it.
If you click Save, you are prompted to select the folder where you wish to save the CSV file.
If you click Open, Windows will attempt to open the CSV file for viewing.
You may be required to specify which application Windows should use to open the file.
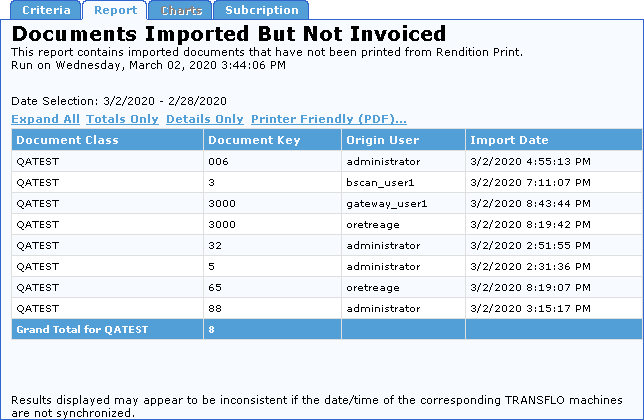
If you did not select the Export Results check box, the Documents Imported But Not Invoiced opens on the Report tab.
7. To create a PDF report, click the Printer Friendly (PDF) link on the Report tab.
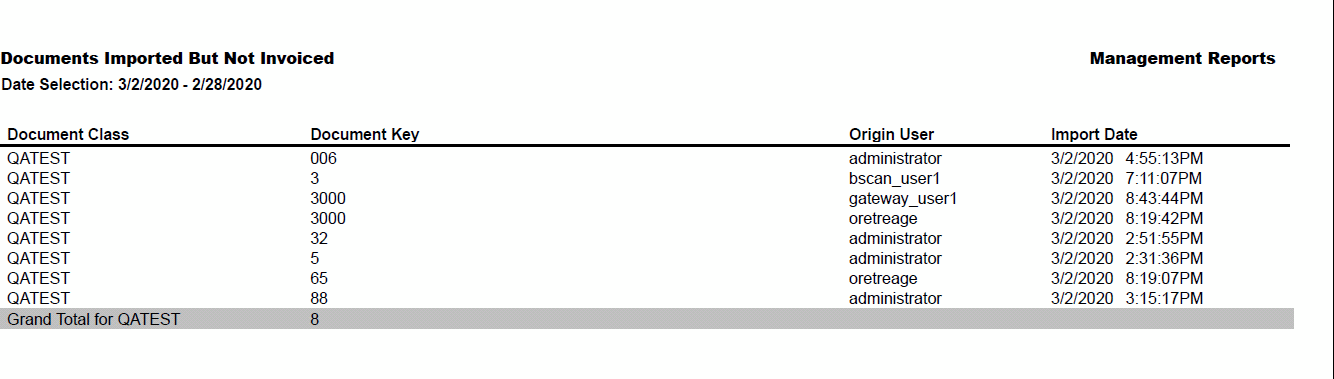
To print this report, click the Print button on the Adobe Acrobat Reader toolbar.
8. To create another Documents Imported But Not Invoiced Report, click the Criteria tab and configure the date and data type criteria for the new report in the same manner as the previous report.
When returning to the Criteria tab after creating a report, all settings from that report are left unchanged to facilitate making small changes to the report criteria.
To restore all report criteria to their default settings, click the Reset button, in the bottom-left corner of the tab.
The header of the Documents Imported But Not Invoiced Report displays the report title, a description of the report, a time stamp indicating when the report was created, and the exclusion period of the report.
The report’s data is presented in the form of a table.
The columns and rows of this table are described below.
|
Column Heading |
Description |
|---|---|
|
Document Class |
The name of the Doc Class to which the report pertains. |
|
Document Key |
The key fields that have been configured in Management Reports as making the item unique. |
|
Import User |
The NT User account of the machine that imported the document. |
|
Import Date |
The date and time the document was imported into the imaging system. |
The Documents Imported But Not Invoiced report contains a row displaying column totals for the Document Class.
This row is described below.
|
Row Title |
Description |
|---|---|
|
Total by <Doc Class> |
The sum total of all rows in Document Key column for a specific Doc Class. |
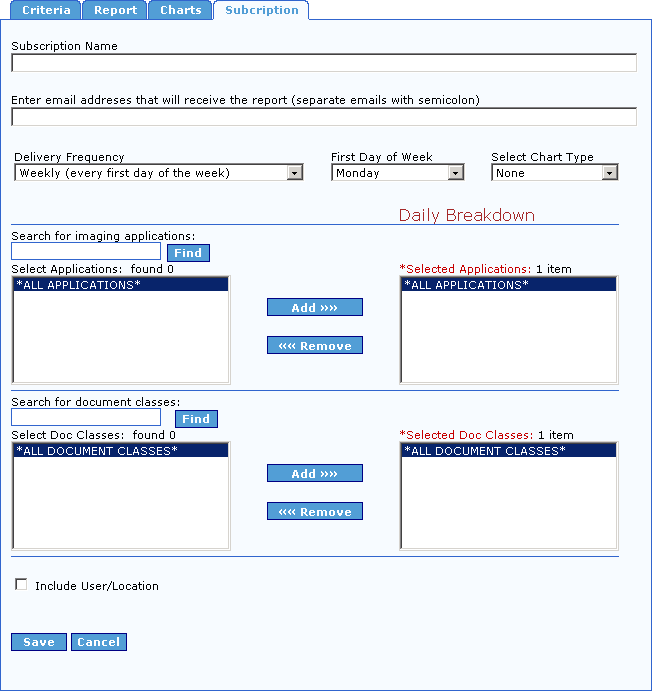
To create a Documents Imported But Not Invoiced Report Subscription:
1. Click the Subscription tab.
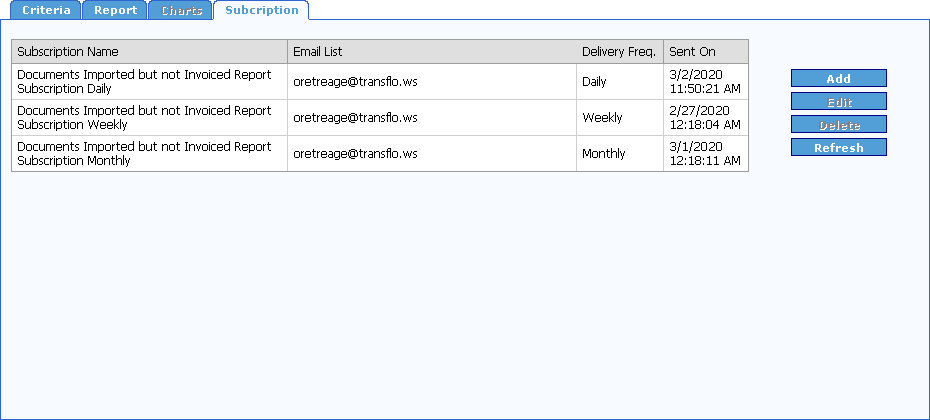
2. Click the Add button.
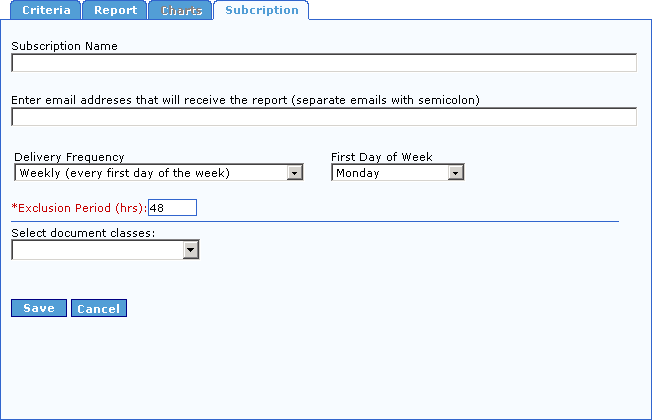
The Add Subscription form for the Documents Imported But Not Invoiced Report opens.
Note: This same form opens when you click the Edit button on the Subscription tab.
3. Enter a name for your report subscription in the Subscription Name box.
4. Enter the list of email addresses separated by semicolons (;) where you would like this report to be sent in the Enter email addresses that will receive the report (separate emails with semicolon) box.
5. Select how often you would like this report to be delivered from the Delivery Frequency drop-down.
Your options are Daily, Weekly, and Monthly.
If you choose Daily, the report will be sent every day with data from the previous day.
If you choose Monthly, the report will be sent the first day of every month for the previous month.
6. If you selected Weekly from the Delivery Frequency drop-down, the First Day of the Week drop-down is visible.
Select the day of the week you would like the report to be emailed from the First Day of the Week drop-down.
The report will be for the previous week.
7. Enter an exclusion period in hours in the Exclusion Period (hrs) box.
8. Select a Document Class from the Select document classes drop-down.
9. To save the report subscription, click the Save button, otherwise click the Cancel button.
The report subscription is added to the Subscription list.
10. To delete a subscription from the list, select it and click the Delete button.
You will not be prompted to confirm you want to delete the subscription.
11. To update your list click the Refresh button.
The Index User Productivity Report is used to view Indexing Statistics for all TRANSFLO® Capture Users.
The report tracks the total number of documents Accepted, Passed, and Rejected per user, as well as the Indexer’s rate in pages per hour.
This report contains a chart that displays the document origination trends by the selected Users, over the selected date range.
The Trend Chart shows count levels (on the y-axis) for dates in the date range (on the x-axis).
To configure and execute an Index User Productivity Report:
1. On the reports menu, under the Productivity Reports heading, click Index User Productivity.
The Index User Productivity interface opens to the Criteria tab.
2. An Index User Productivity Report can be created either for a range of dates with report data displayed by day, or for a single date with report data displayed by hour.
When creating an Index User Productivity Report, first decide which of these two options will be used.
This setting is configured via the Report Breakdown list, in the top-right portion of the Criteria tab which contains two settings, Daily and Hourly, with the default setting being Daily.
If you instead wish to have the report display an hourly breakdown for a single day, expand the list and click Hourly.
Next, select the date range if you are configuring a daily report breakdown, or the single date if you are configuring an hourly report breakdown.
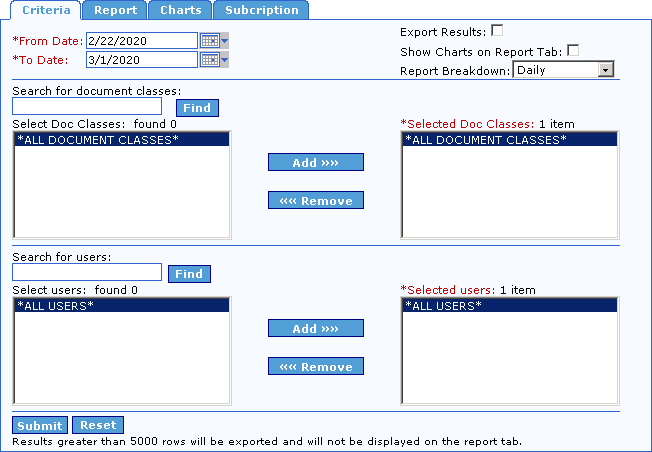
For a daily report breakdown, enter the dates in the From Date and To Dates boxes.
The default date range spans backwards seven calendar days from the previous day’s date.
If the default date range is not the desired range, enter the desired dates in the From Date and To Dates boxes.
To do this, click in the appropriate box, delete the default date, and type a new date; alternatively, you can click the calendar button to the right of the date box and select a new date from the pop-up calendar that appears.
To select a date from the calendar, first select the Month and Year for the date.
Click the arrow to the left or right of the Month or Year to move the calendar backwards or forwards until you arrive at the desired Month and Year.
Next, click the particular Day that you wish to use in the date range.
Any Days appearing in gray are in the future and cannot be selected.
When you click a Day, the calendar disappears, and the selected date is entered in the corresponding date box.
Note: The date in the From Date box must be earlier than that in the To Date box.
To restrict the date range to a single day, enter the same date in both boxes.
For an hourly report breakdown, enter the report date in the Date box.
By default, hourly reports are based on the previous day’s date.
To base the report on a different date, enter that date in the Date box either by typing it or by clicking the calendar button and selecting a date from the pop-up calendar. (For instructions on selecting a date from the pop-up calendar, refer to the previous topic)
3. On the Criteria tab, you are required to configure the data types used in creating the Index User Productivity Report.
The first data type presented on the tab is Document Class.
By default, all available Document Classes are selected for inclusion in the report.
This is shown in the Selected Doc Classes box, which contains the default value *ALL DOCUMENT CLASSES*.
To base your report on all Document Classes instead of just one or a few, it is not necessary to make any changes to the default Document Class settings.
If, however, you wish to create a report based on only one, or a handful of Document Classes, you must first execute a search for the desired Document Classes.
This is done via the Search for document classes box.
In this box, type the search criteria for the desired Document Classes, and then click Find or press the [Enter] key.
The results of the search are displayed in the Select Doc Classes box.
The basic search string rules are as follows:
| String | Result |
|---|---|
|
*(asterisk) |
All available Doc Classes are displayed. |
|
Up to 3 characters, e.g., f, fa, or far |
All Doc Classes whose names begin with the entered string are displayed. For example, the strings f and fa could display the Doc Classesfalcon and family, but the string far would display neither. |
|
More than 3 characters, e.g., east |
All Doc Classes whose names contain the string anywhere in the name are returned. For example, the string east could display the Doc Classeseastern, northeastern, and southeast. |
4. After the desired search results have been returned to the Select Doc Classes box, the next step before generating a report is to remove the default Document Class from the Selected Doc Classes box.
This is because the default selection, *ALL DOCUMENT CLASSES*, already includes the individual Document Classes that were returned by your search.
The *ALL DOCUMENT CLASSES* entry is already selected.
To remove it from the Selected Doc Classes box, click the Remove button.
5. Now you can move individual Document Classes from the Select Doc Classes box to the Selected Doc Classes box.
To do this, click the desired Document Classes to select them, and then click the Add button.
The Document Classes now appear in the Selected Doc Classes box.
To move any of these Document Classes back to the Select Doc Classes box (meaning that they will not be included in the report), click the desired Document Classes to select them, and then click Remove.
Note: To select multiple consecutive Document Classes at once, click the first consecutive Document Class to select it, and then click the final consecutive Document Class while holding down the [Shift] key.
To select multiple non-consecutive Document Classes at once, press and hold the [Ctrl] key, while clicking the desired Document Classes.
6. To add specific Users to your search criteria, select which Users should be included in the report.
The procedure for doing this is identical to the procedure for selecting Document Classes.
To base your report on all Users instead of on just a few, it is not necessary to make any changes, since All Users is the default.
7. To display the Indexing User Productivity Chart on the Report tab, select the Show Chart on Report Tab check box, before running the report.
8. You are almost ready to generate the Index User Productivity Report.
The last step before doing so is to indicate how you want to view the report data.
By default, the data is presented on-screen on the Report tab.
However, the option to export the results to spreadsheet format is available.
To have the report results generated as a CSV file viewable with most spreadsheet applications, select the Export Results check box, located to the right of the date fields, before running the report.
9. When you are ready to generate the Index User Productivity Report, click the Submit button, in the bottom-left corner of the Criteria tab.
If you selected the Export Results check box, a Windows dialog box appears, asking if you would like to open the file or save it.
If you click Save, you are prompted to select the folder where you wish to save the CSV file.
If you click Open, Windows will attempt to open the CSV file for viewing.
You may be required to specify which application Windows should use to open the file.
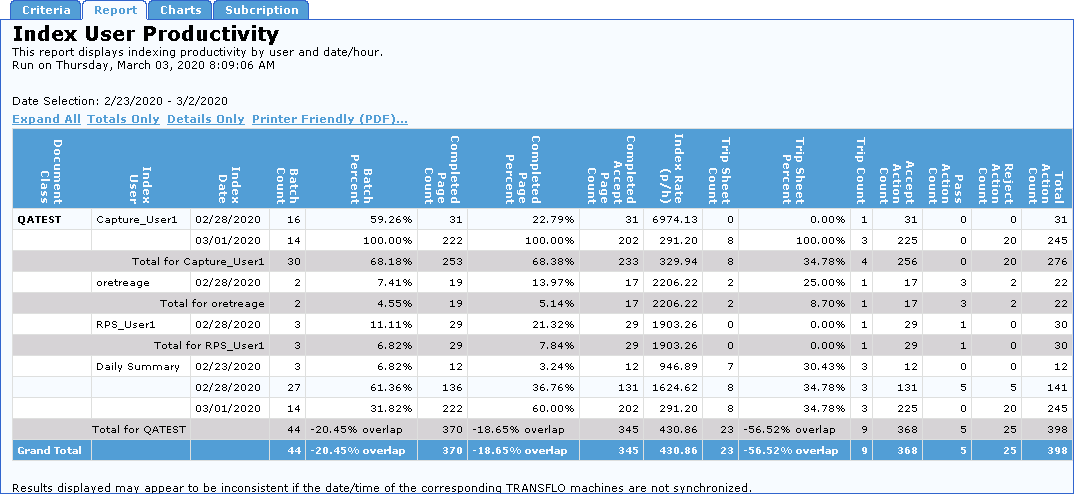
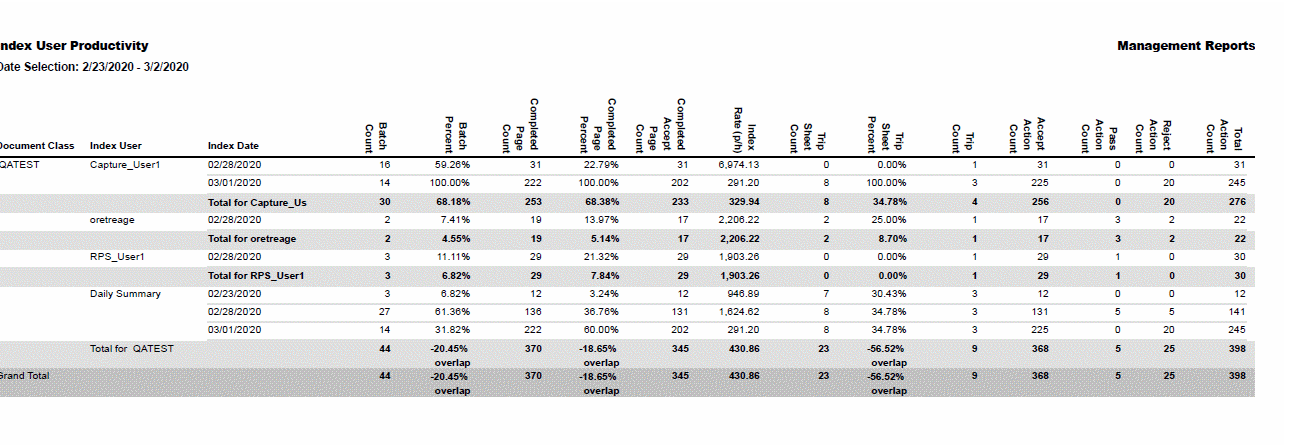
If you did not select the Export Results check box, the Index User Productivity Report tab appears and displays the report in a structured format similar to the one shown below.
For more information about this report, see Interpret an Index User Productivity Report.
Each report contains three links that allow you to change how the report information appears.
-
To view all data in the report, click the Expand All link. This is the default view.
-
To hide the report details, displaying only the totals, click the Totals Only link.
-
To show just the details of the report, hiding the totals, click the Details Only link.
10. (Optional) Regardless of whether or not you elected to have the report exported in CSV format, you can also view the report in a printable PDF format.
To create a PDF report, click the Printer Friendly (PDF) link on the Report tab.
A PDF report similar to the one shown below appears.
To print this report, click the Print button on the Adobe Acrobat Reader toolbar.
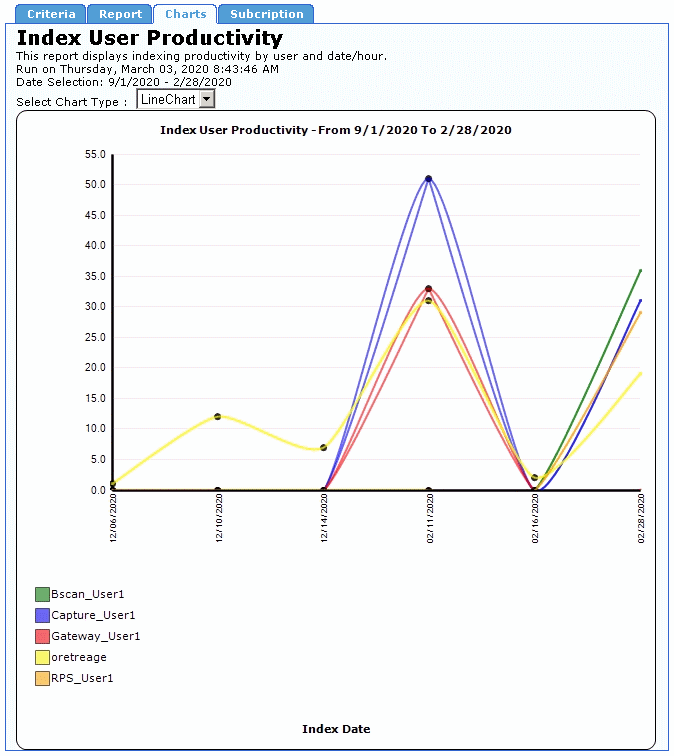
11. This report includes a chart that displays the document origination trends by the selected Users over the selected date range.
The chart shows count levels (on the y-axis) for dates in the date range (on the x-axis).
To view this chart, click the Charts tab.
A chart similar to the one shown below appears.
You can also view the data as a pie chart.
To do this, expand the Select Chart Type list and click PieChart.
Note: If you selected the Show Charts on Report Tab check box on the Criteria tab, the chart also appears on the Report tab.
12. To create another Index User Productivity Report, click the Criteria tab and configure the date criterion for the new report in the same manner as the previous report.
When returning to the Criteria tab after creating a report, all settings for that report are left unchanged, to facilitate making small changes to the report criteria.
To restore all report criteria to their default settings, click the Reset button, in the bottom-left corner of the tab.
The header of the Index User Productivity Report displays the report title, a description of the report, a time stamp indicating when the report was created, and the dates spanned by the report.
The report’s data is presented in the form of a table.
The columns and rows of this table are described below.
|
Column Heading |
Description |
|---|---|
|
Document Class |
The name of the Doc Class to which the report pertains, or to which this section of the report pertains, if there are multiple Doc Classes in the report. |
|
Index User |
The name of the TRANSFLO® Capture User to which the report pertains, or to which this section of the report pertains, if there are multiple Users in the report. Below the User portion of the report, this column is used to indicate the start of the summary section (Daily Summary or Hourly Summary). |
|
Index Date * Daily Report Breakdown only |
The date on which TRANSFLO® Capture began processing the Batches represented in this row. In the Daily Summary portion of the report, this column lists the dates corresponding to the summary statistics. |
|
Index Hour * Hourly Report Breakdown only |
The hour in which TRANSFLO® Capture began processing the Batches represented in this row. In the Hourly Summary portion of the report, this column lists all hours during which any User began indexing Batches on the selected day. That is, any hour that does not appear in the list is an hour during which no Users began indexing Batches, for the indicated Doc Class. |
|
Batch Count |
The number of Batches with at least one page Accepted & Imported or Rejected by the Index Userfor the indicated day or hour. In the summary portion of the report, the Batch Count number represents the total number of Batches with at least one page Accepted & Imported or Rejected for the given Doc Class. |
|
Column Heading |
Description |
|---|---|
|
Batch Percent |
For a Capture User, this is the percentage of all BatchesAccepted or Rejected (but not Passed) by the Capture User versus the total number of BatchesAccepted or Rejected by all Users for the day or hour indicated for the Doc Class indicated. The percentage shown is determined by the calculation: (Batch Count / Total Batch Count) * 100 where the Batch Count reflects a single date or single hour in the Capture User’s portion of the report, and the Total Batch Count reflects the same date or hour in the Daily or Hourly Summary portion of the report.
For a “Total by <CaptureUser>” row, this is the percentage, for a single Doc Class, of all BatchesAccepted or Rejected (but not Passed) by the Capture User versus the total number of batches Accepted or Rejected by all Users for the complete time span covered by the report. The percentage shown is determined by the calculation: (Total Batch Count for Single User / Total Batch Count for All Users) * 100
For a “Daily Summary” or “Hourly Summary” row, this is the percentage, for a single Doc Class, of all batches Accepted or Rejected (but not Passed) by all Capture Users for a given date or hour versus the total number of BatchesAccepted or Rejected during the complete time span covered by the report. The percentage shown is determined by the calculation: (Total Batch Count for Single Date or Hour / Total Batch Count for Report Timespan) * 100
For the “Total for <DocClass>” row, this is the percentage, for a single Doc Class, of batch-work overlap for the Capture Users named in the report versus all Capture Users who worked on the Batches. Overlap is when two or more Capture Users perform work on the same batch. The percentage shown is determined by the calculation: (Total Batch Count for All Capture Users in Report / Total Batch Count for All Capture Users in Doc Class) * 100 - 100
Negative overlap indicates that not all Capture Users who Accepted or RejectedBatches are represented in the report. Positive overlap means that two or more Capture Users performed work on the same batch, e.g., one User Rejected a batch, but another User Accepted it.
(more on the chart below...) |
|
Column Heading |
Description |
|---|---|
|
Batch Percent (cont.) |
For the “Grand Total” row, this is the average percentage of overlap for all Doc Classes in the report. The percentage shown is determined by the calculation: [(The sum of all DAILY totals for each and all Document Class {divided by} / The sum of all USER total fields for each and all Document Class) {multiplied by} * -100 ] {then plus} + 100 |
|
Completed Page Percent |
For a Capture User, this is the percentage of all pages Accepted or Rejected (but not Passed) by the Capture User versus the total number of pages Accepted or Rejected by all Users for the day or hour indicated for the Doc Class indicated. The percentage shown is determined by the calculation: (Completed Page Count / Total Completed Page Count) * 100
where the Completed Page Count reflects a single date or single hour in the Capture User’s portion of the report, and the Total Completed Page Count reflects the same date or hour in the Daily or Hourly Summary portion of the report.
For a “Total by <CaptureUser>” row, this is the percentage, for a single Doc Class, of all pages Accepted or Rejected (but not Passed) by the Capture User versus the total number of pages Accepted or Rejected by all Users for the complete time span covered by the report. The percentage shown is determined by the calculation: (Total Completed Page Count for Single User / Total Completed Page Count for All Users) * 100
For a “Daily Summary” or “Hourly Summary” row, this is the percentage, for a single Doc Class, of all pages Accepted or Rejected (but not Passed) by all Capture Users for a given date or hour versus the total number of pages Accepted or Rejected during the complete time span covered by the report. The percentage shown is determined by the calculation: (Total Completed Page Count for Single Date or Hour / Total Completed Page Count for Report Timespan) * 100
(more on the chart below...) |
|
Column Heading |
Description |
|---|---|
|
Completed Page Percent (cont.) |
For the “Total for <DocClass>” row, this is the percentage, for a single Doc Class, of batch-work overlap for the Capture Users named in the report versus all Capture Users who worked on the pages. Overlap is when two or more Capture Users perform work on the same page. The percentage shown is determined by the calculation: (Total Completed Page Count for All Capture Users in Report / Total Completed Page Count for All Capture Users in Doc Class) * 100 - 100
Negative overlap indicates that not all Capture Users who Accepted or Rejected pages are represented in the report. Positive overlap means that two or more Capture Users performed work on the same page, e.g., one User Rejected a page, but another User Accepted it.
For the “Grand Total” row, this is the average percentage of overlap for all Doc Classes in the report. The percentage shown is determined by the calculation: (Sum of all Doc Class Overlap Percentages / 100) / Number of Doc Classes * 100 |
|
Completed Page Count |
The number of pages either Accepted & Imported, or Rejected, by the Capture User for the indicated day or hour. In the summary portion of the report, the Completed Page Count number of pages either Accepted & Imported, or Rejected, for the given Doc Class. |
|
Completed Accept Page Count |
The number of completed pages accepted by the Capture User. |
|
Index Rate (p / h) |
The rate at which the Accepted and Rejected pages were indexed, expressed in pages per hour. To determine the Index Rate for a report, Management Reports uses the following calculation: (Total Accept and Reject Page Count * 3,600,000) / Total Time Spent in Index in Milliseconds
The number 3,600,000 is the number of milliseconds in one hour, and is used to convert the page count rate to hours. |
|
Trip Sheet Count |
The number of trip sheets counted by Capture, either for a specific date or as a sum total, depending on which row is being viewed. |
|
Column Heading |
Description |
|---|---|
|
Trip Sheet Percent |
For a Capture User, this is the percentage of all trip sheets Accepted or Rejected (but not Passed) by the Capture User versus the total number of trip sheets Accepted or Rejected by all Users for the day or hour indicated for the Doc Class indicated. The % shown is determined by the calculation: (Trip Sheet Count / Total Trip Sheet Count) * 100 where the Trip Sheet Count reflects a single date or single hour in the Capture User’s portion of the report, and the Total Trip Sheet Count reflects the same date or hour in the Daily or Hourly Summary portion of the report.
For a “Total by <CaptureUser>” row, this is the percentage, for a single Doc Class, of all trip sheets Accepted or Rejected (but not Passed) by the Capture User versus the total number of trip sheets Accepted or Rejected by all Users for the complete time span covered by the report. The % shown is determined by the calculation: (Total Trip Sheet Count for Single User / Total Trip Sheet Count for All Users) * 100
For a “Daily Summary” or “Hourly Summary” row, this is the percentage, for a single Doc Class, of all trip sheets Accepted or Rejected (but not Passed) by all Capture Users for a given date or hour versus the total number of trip sheets Accepted or Rejected during the complete times pan covered by the report. The percentage shown is determined by the calculation: (Total Trip Sheet Count for Single Date or Hour / Total Trip Sheet Count for Report Timespan) * 100
For the “Total for <DocClass>” row, this is the percentage, for a single Doc Class, of batch-work overlap for the Capture Users named in the report versus all Capture Users who worked on the trip sheets. Overlap is when two or more Capture Users perform work on the same trip sheet. The percentage shown is determined by the calculation: (Total Trip Sheet Count for All Capture Users in Report / Total Trip Sheet Count for All Capture Users in Doc Class) * 100 - 100
Negative overlap indicates that not all Capture Users who Accepted or Rejected trip sheets are represented in the report. Positive overlap means that two or more Capture Users performed work on the same trip sheet, e.g. one User Rejected a trip sheet, but another User Accepted it.
(more on the chart below...) |
|
Column Heading |
Description |
|---|---|
|
Trip Sheet Percent (cont.) |
For the “Grand Total” row, this is the average percentage of overlap for all Doc Classes in the report. The percentage shown is determined by the calculation: (Sum of all Doc Class Overlap Percentages / 100) / Number of Doc Classes * 100 |
|
Trip Count |
The number of load numbers counted by Capture, either for a specific date or as a sum total, depending on which row is being viewed. |
|
Accept Action Count |
The number of Accept actions, determined by the number of times that the user clicked the Accept button in Capture. Note: This value may be not correspond to the batch or Page count columns because actions are rolled up real-time, whereas completed Documents are rolled up after Import. |
|
Pass Action Count |
The number Pass actions, determined by of times that the User clicked the Pass button in Capture. |
|
Reject Action Count |
The number of Reject actions, determined by the number of times that the User clicked the Reject button in Capture. |
|
Total Action Count |
The sum total number of Accept, Pass, and Reject actions performed by the Capture User. Note: This value may be not correspond to the batch or Page count columns because actions are rolled up real-time, whereas completed Documents are rolled up after Import. |
The Index User Productivity report contains rows displaying column totals for each Capture User and Doc Class individually and for all represented Doc Classes as a whole.
These rows are described below.
|
Row Title |
Description |
|---|---|
|
Total for <CaptureUser> |
The sum total or average of all rows in a particular column for a specific Capture User in a specific Doc Class. |
|
Total for <DocClass> |
The sum total or average of all rows in a particular column (excluding percentage columns) for a specific Doc Class. For percentage columns, the column total is presented in the form of a percent overlap. |
|
Grand Total |
The sum total or average of all rows in a particular column (excluding percentage columns) for all Doc Classes. For percentage columns, the column total is presented in the form of a percent overlap. |
Create an Index User Productivity Report Subscription
To create an Index User Productivity Report Subscription:
1. Click the Subscription tab.
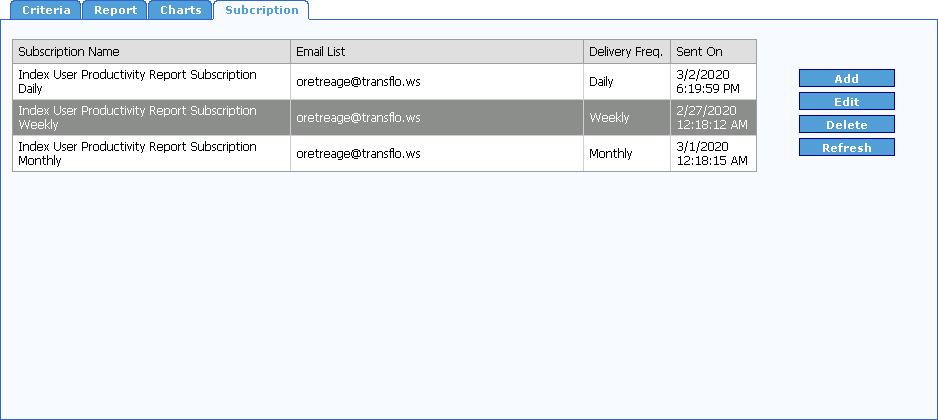
2. Click the Add button.
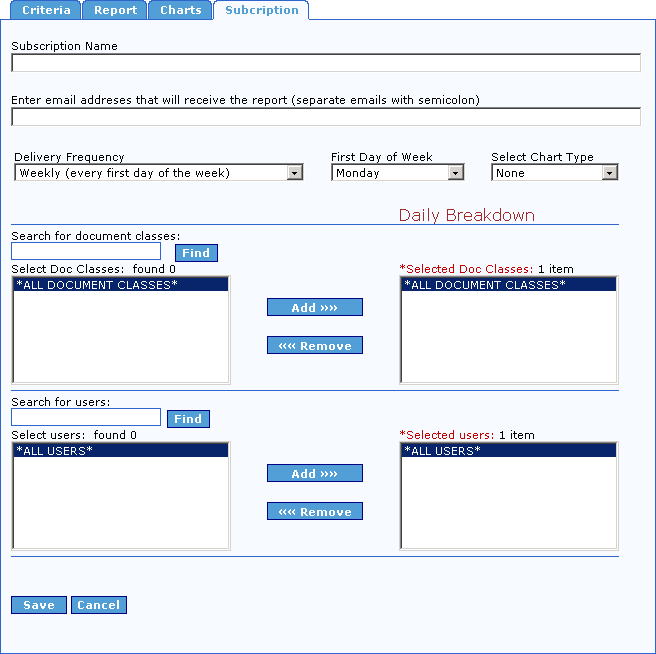
The Add Subscription form for the Index User Productivity Report opens.
Note: This same form opens when you click the Edit button on the Subscription tab.
3. Enter a name for your report subscription in the Subscription Name box.
4. Enter the list of email addresses separated by semicolons (;) where you would like this report to be sent in the Enter email addresses that will receive the report (separate emails with semicolon) box.
5. Select how often you would like this report to be delivered from the Delivery Frequency drop-down.
Your options are Daily, Weekly, and Monthly.
If you choose Daily, the report will be sent every day with data from the previous day, and the report will show an hourly breakdown.
If you choose Monthly, the report will be sent the first day of every month for the previous month, and the report will show a daily breakdown.
6. If you selected Weekly from the Delivery Frequency drop-down, the First Day of the Week drop-down is visible.
Select the day of the week you would like the report to be emailed from the First Day of the Week drop-down.
The report will be for the previous week, the report will show a daily breakdown.
7. Select the type of chart you want to include with you report subscription from the Select Chart Type drop-down.
8. Select Document Classes and Users in the same manner as described in Create an Index User Productivity Report.
9. To save the report subscription click the Save button, otherwise click the Cancel button.
The report subscription is added to the Subscription list.
10. To delete a subscription from the list, select it and click the Delete button.
You will not be prompted to confirm you want to delete the subscription.
11. To update your list, click the Refresh button.
The Origination Trend by User Report is used to track the total number of originated documents for each user, over a specified date range. This report contains an Origination Trends Chart that displays activity trends by Activity Type over the date range entered on the Criteria tab. The Origination Trends chart displays document count levels (on the y-axis) for dates in the date range (on the x-axis). A Pie Chart is also available for this report.
To configure and execute an Origination Trend by User Report:
1. On the Reports menu, under the Productivity Reports heading, click Origination Trend by User.
The Origination Trend by User interface opens to the Criteria tab.
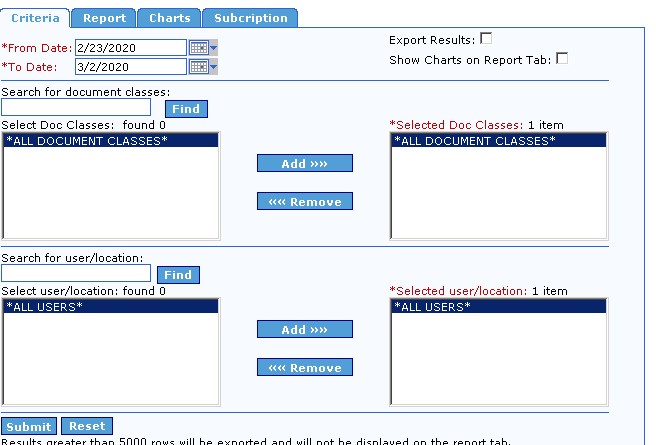
2. Begin configuring the Origination Trend by User Report, by entering the date range for the report.
The default date range spans backwards seven calendar days from the previous day’s date.
If the default date range is not the desired range, enter the desired dates in the From Date and To Date boxes.
To do this, click in the appropriate box, delete the default date, and type a new date, or click the calendar button to the right of the box and select the date from the pop-up calendar that appears.
To select a date from the calendar, first select the Month and Year for the date.
Click the arrow to the left or right of the Monthor Year to move the calendar backwards or forwards until you arrive at the desired Month and Year.
Next, click the particular day that you wish to use in the date range.
Any days appearing in gray are in the future and cannot be selected.
Note: The date in the From Date box must be earlier than that in the To Date box.
To restrict the date range to a single day, enter the same date in both boxes.
3. The first data type used by the Origination Trend by User Report is Document Class.
By default, all available Document Classes are selected for inclusion in the report.
This is shown in the Selected Doc Classes box, which contains the default value *ALL DOCUMENT CLASSES*.
To base your report on all Document Classes instead of on just a few, it is not necessary to make any changes to the default Document Class settings.
If, however, you wish to create a report based on only one or a handful of Document Classes, you must first execute a search for the desired Document Classes.
This is easily done via the Search for document classes box.
In this box, enter search criteria for the desired Document Classes, and then click Find or press the [Enter] key.
The results of the search are displayed in the Select Doc Classes box.
The basic search string rules are as follows:
| String | Result |
|---|---|
|
*(asterisk) |
All available Doc Classes are displayed. |
|
Up to 3 characters, e.g., f, fa, or far |
All Doc Classes whose names begin with the entered string are displayed. For example, the strings f and fa could display the Doc Classesfalcon and family, but the string far would display neither. |
|
More than 3 characters, e.g., east |
All Doc Classes whose names contain the string anywhere in the name are returned. For example, the string east could display the Doc Classeseastern, northeastern, and southeast. |
4. After the desired Document Classes have been added to the Select Doc Classes box, the next step before generating a report, is to remove the default Document Class from the Selected Doc Classes box.
This is because the default selection, *ALL DOCUMENT CLASSES*, already includes the individual Document Classes that were returned by your search.
The *ALL DOCUMENT CLASSES* entry is already selected, so to remove it from the Selected Doc Classes box, simply click the Remove button.
5. Now you can move individual Document Classes to the Selected Doc Classes box.
To do this, click the desired Document Classes in the Select Doc Classes box to select them, and then click the Add button.
The Document Classes now appear in the Selected Doc Classes box.
To move any of these Document Classes back to the Select Doc Classes box (meaning that they will not be included in the report), click the desired Document Classes to select them, and then click Remove.
Note: To select multiple consecutive Document Classes at once, click the first consecutive Document Class to select it, and then click the final consecutive Document Class while holding the [Shift] key.
To select multiple non-consecutive Document Classes at once, press and hold the [Ctrl] key while clicking the desired Document Classes.
6. To add Users to your search criteria, select which Users should be included in the report.
The procedure for doing this is identical to the procedure for selecting Document Classes.
To base your report on all Users instead of on just a few, it is not necessary to use this feature since All Users is the default.
7. You are almost ready to generate the Origination Trend by User Report.
The last step before doing so is to indicate how you want to view the report data.
By default, the data is presented on-screen on the Report tab.
However, the option to export the results to spreadsheet format is available.
To have the report results generated as a CSV file viewable with most spreadsheet applications, select the Export Results check box, located to the right of the date fields, before running the report.
8. To display the Origination Trend by User Chart on the Report tab, select the Show Chart on Report Tab check box.
Otherwise, the chart will be displayed only on the Charts tab.
9. When you are ready to generate the Origination Trend by User Report, click the Submit button, in the bottom-left corner of the Criteria tab.
If you selected the Export Results check box, a Windows dialog box appears asking if you would like to open the file or save it.
If you click Save, you are prompted to select the folder where you wish to save the CSV file.
If you click Open, Windows will attempt to open the CSV file for viewing.
You may be required to specify which application Windows should use to open the file.
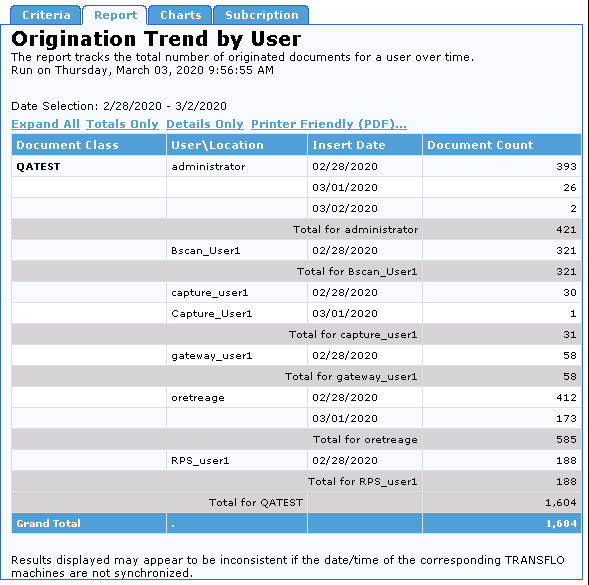
If you did not select the Export Results check box, the Origination Trend by User Report tab appears and displays the report in a structured format similar to the one shown below.
10. Regardless of whether or not you elected to have the report exported in CSV format, you can also view the report in a printable PDF format.
To create a PDF report, click the Printer Friendly (PDF) link on the Report tab.
A PDF report similar to the one shown below appears.
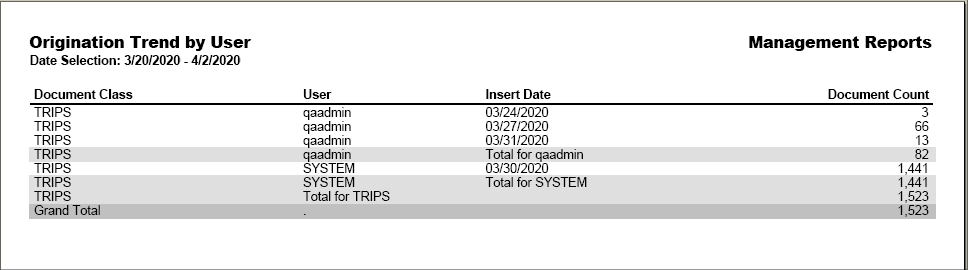
To print this report, click the Print icon on the Adobe Acrobat Reader toolbar.
11. This report contains an Origination Trends Chart that displays activity trends by Activity Type over the date range entered on the Criteria tab.
The Origination Trends chart shows count levels (on the y-axis) for dates in the date range (on the x-axis).
To view this chart, click the Charts tab, and select LineChart from the Select Chart Type drop-down.
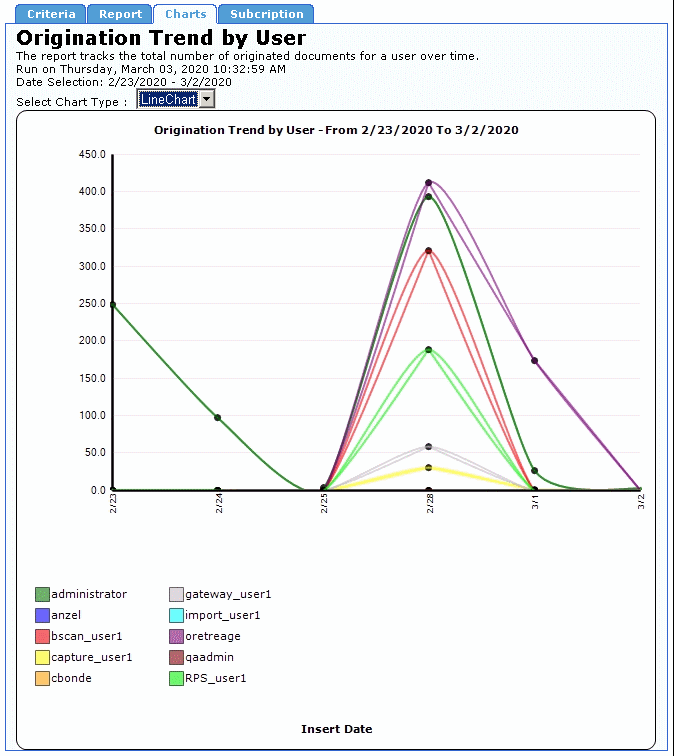
To view the report as a pie chart select PieChart from the Select Chart Type drop-down.
Note: If you selected the Show Charts on Report Tab check box on the Criteria tab, the chart also appears on the Report tab.
12. To create another Origination Trend by User Report, click the Criteria tab and configure the date and data type criteria for the new report, in a similar manner as the previous report.
When returning to the Criteria tab after creating a report, all settings from that report are left unchanged, to facilitate making small changes to the report criteria.
To restore all report criteria to their default settings, click the Reset button, in the bottom-left corner of the tab.
Interpret an Origination Trend by User Report
The header of the Origination Trend by User Report displays the report title, a description of the report, a time stamp indicating when the report was created, and the dates spanned by the report.
The report’s data is presented in the form of a table.
The columns and rows of this table are described below.
|
Column Heading |
Description |
|---|---|
|
Document Class |
The name of the Doc Class to which the report pertains, or to which this section of the report pertains, if there are multiple Doc Classes in the report. |
|
User |
The TRANSFLO® ID of the User who originated the document. |
|
Date |
The date when the document was originated. |
|
Document Count |
The number of documents originated by a given User on a given date. |
The Origination Trend by User report contains rows displaying column totals for each Document Class individually and for all represented Document Classes as a whole.
These rows are described below.
|
Row Title |
Description |
|---|---|
|
Total for <User> |
The sum total of all rows in the Document Count column for a specific User. |
|
Total for <DocClass> |
The sum total of all rows in the Document Count column for a specific Doc Class. |
|
Grand Total |
The sum total of all rows in the Document Count column for all Doc Classes. |
Create an Origination Trend by User Report Subscription
To create an Origination Trend by User Report Subscription:
1. Click the Subscription tab.
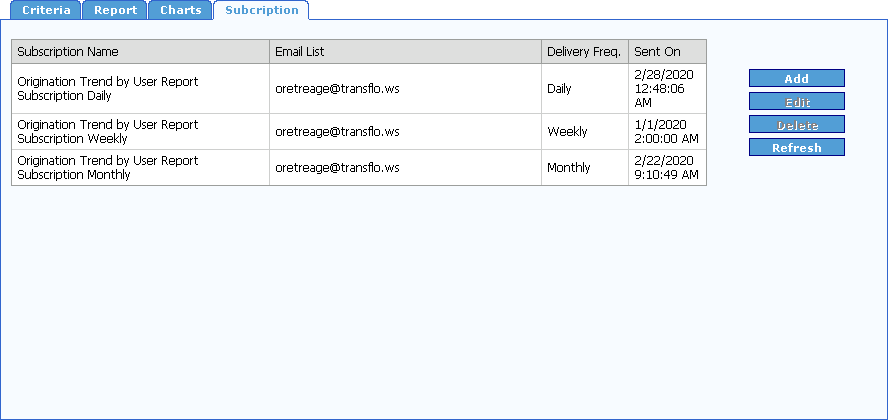
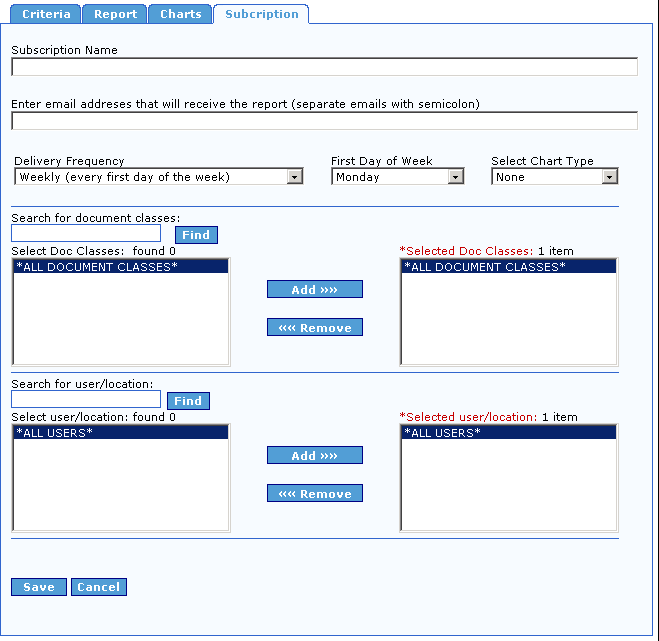
2. Click the Add button.
The Add Subscription form for the Origination Trend by User Report opens.
Note: This same form opens when you click the Edit button on the Subscription tab.
3. Enter a name for your report subscription in the Subscription Name box.
4. Enter the list of email addresses separated by semicolons (;) where you would like this report to be sent in the Enter email addresses that will receive the report (separate emails with semicolon) box.
5. Select how often you would like this report to be delivered from the Delivery Frequency drop-down.
Your options are Daily, Weekly, and Monthly.
If you choose Daily, the report will be sent every day with data from the previous day, and the report will show an hourly breakdown.
If you choose Monthly, the report will be sent the first day of every month for the previous month, and the report will show a daily breakdown.
6. If you selected Weekly from the Delivery Frequency drop-down, the First Day of the Week drop-down is visible.
Select the day of the week you would like the report to be emailed from the First Day of the Week drop-down.
The report will be for the previous week, and the report will show a daily breakdown.
7. Select the type of chart you want to include with you report subscription, from the Select Chart Type drop-down.
8. Select Document Classes and Users in the same manner as described in Create an Origination Trend by User Report.
9. To save the report subscription click the Save button, otherwise click the Cancel button.
10. The report subscription is added to the Subscription list.
11. To delete a subscription from the list select it, and click the Delete button.
You will not be prompted to confirm you want to delete the subscription.
12. To update your list click the Refresh button.
The Origination/Indexing/Import Report is used to track the total number of documents that were Originated, Indexed, and Imported for a specified date range.
This report contains an Activity Trends Chart that displays activity trends by Activity Type over the date range entered on the Criteria tab.
The Trend Chart shows count levels (on the y-axis) for dates in the date range (on the x-axis).
A Pie Chart is also available for this report.
To configure and execute an Origination/Indexing/Import Report:
1. On the Reports menu, under the Productivity Reports heading, click Origination/Indexing/Import.
The Origination/Indexing/Import interface opens to the Criteria tab.
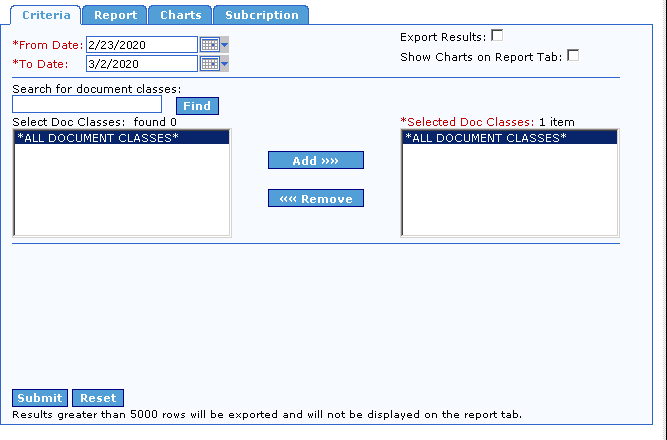
2. Begin configuring the Origination/Indexing/Import Report, by entering the date range for the report.
The default date range spans backwards seven calendar days from the previous day’s date.
If the default date range is not the desired range, enter the desired dates in the From Date and To Date boxes.
To do this, click in the appropriate box, delete the default date, and type a new date, or click the calendar button to the right of the box and select the date from the pop-up calendar that appears.
To select a date from the calendar, first select the Month and Year for the date.
Click the arrow to the left or right of the Month or Year to move the calendar backwards or forwards, until you arrive at the desired Month and Year.
Next, click the particular Day that you wish to use in the date range.
Any Days appearing in gray are in the future and cannot be selected.
When you click a Day, the calendar disappears and the selected date is entered, in the corresponding date box.
Note: The date in the From Date box must be earlier than that in the To Date box.
To restrict the date range to a single Day, enter the same date in both boxes.
3. The sole criteria used by the Origination/Indexing/Import Report is Document Class.
By default, all available Document Classes are selected for inclusion in the report.
This is shown in the Selected Doc Classes box, which contains the default value *ALL DOCUMENT CLASSES*.
To base your report on all Document Classes instead of on just a few, it is not necessary to make any changes to the default Document Class settings.
If, however, you wish to create a report based on only one or a handful of Document Classes, you must first execute a search for the desired Document Classes.
This is easily done via the Search for document classes box.
In this box, enter search criteria for the desired Document Classes, and then click Find or press the [Enter] key.
The results of the search are displayed in the Select Doc Classes box.
The basic search string rules are as follows:
| String | Result |
|---|---|
|
*(asterisk) |
All available Doc Classes are displayed. |
|
Up to 3 characters, e.g., f, fa, or far |
All Doc Classes whose names begin with the entered string are displayed. For example, the strings f and fa could display the Doc Classesfalcon and family, but the string far would display neither. |
|
More than 3 characters, e.g., east |
All Doc Classes whose names contain the string anywhere in the name are returned. For example, the string east could display the Doc Classeseastern, northeastern, and southeast. |
4. After the desired Document Classes have been added to the Select Doc Classes box, the next step before generating a report, is to remove the default Document Class from the Selected Doc Classes box.
This is because the default selection, *ALL DOCUMENT CLASSES*, already includes the individual Document Classes that were returned by your search.
The *ALL DOCUMENT CLASSES* entry is already selected, so to remove it from the Selected Doc Classes box, simply click the Remove button.
5. Now you can move individual Document Classes to the Selected Doc Classes box.
To do this, click the desired Document Classes in the Select Doc Classes box to select them, and then click the Add button.
The Document Classes now appear in the Selected Doc Classes box.
To move any of these Document Classes back to the Select Doc Classes box (meaning that they will not be included in the report), click the desired Document Classes to select them, and then click Remove.
Note: To select multiple consecutive Document Classes at once, click the first consecutive Document Class to select it, and then click the final consecutive Document Class while holding the [Shift] key.
To select multiple non- consecutive Document Classes at once, press and hold the [Ctrl] key while clicking the desired Document Classes.
6. You are almost ready to generate the Origination/Indexing/Import Report.
The last step before doing so is to indicate how you want to view the report data.
By default, the data is presented on-screen on the Report tab.
However, the option to export the results to spreadsheet format is available.
To have the report results generated as a CSV file viewable with most spreadsheet applications, select the Export Results check box, located to the right of the date fields, before running the report.
7. To display the Origination/Indexing/Import Chart on the Report tab, select the Show Chart on Report Tab check box.
Otherwise, the chart will be displayed only on the Charts tab.
8. When you are ready to generate the Origination/Indexing/Import Report, click the Submit button in the bottom-left corner of the Criteria tab.
If you selected the Export Results check box, a Windows dialog box appears asking if you would like to open the file or save it.
If you click Save, you are prompted to select the folder where you wish to save the CSV file.
If you click Open, Windows will attempt to open the CSV file for viewing.
You may be required to specify which application Windows should use to open the file.
9. If you did not select the Export Results check box, the Origination/Indexing/ Import Report tab appears and displays the report in a structured format, similar to the one shown below.
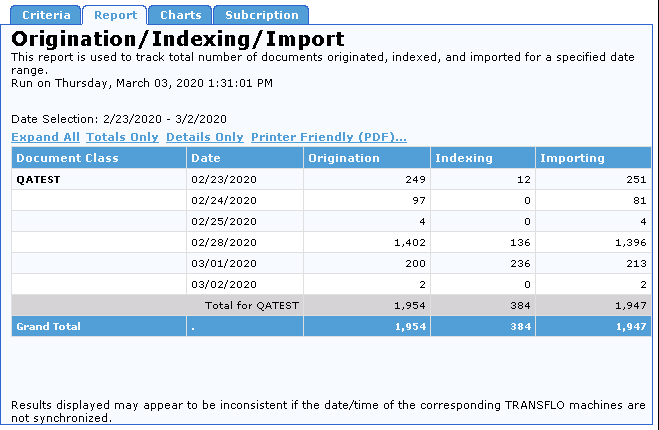
10. Regardless of whether or not you elected to have the report exported in CSV format, you can also view the report in a printable PDF format.
To create a PDF report, click the Printer Friendly (PDF) link on the Report tab.
A PDF report similar to the one shown below is created.
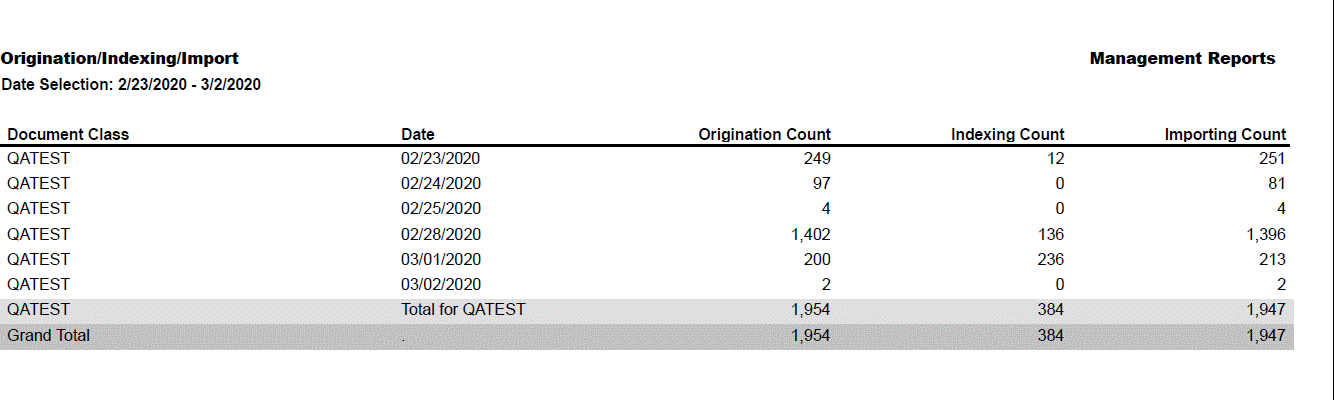
To print this report, click the Print button on the Adobe Acrobat Reader toolbar.
11. This report contains an Activity Trends Chart that displays activity trends by Activity Type over the date range entered on the Criteria tab.
The Trend Chart shows count levels (on the y-axis) for dates in the date range (on the x-axis).
To view this chart, click the Charts tab.
A chart similar to the one below appears.
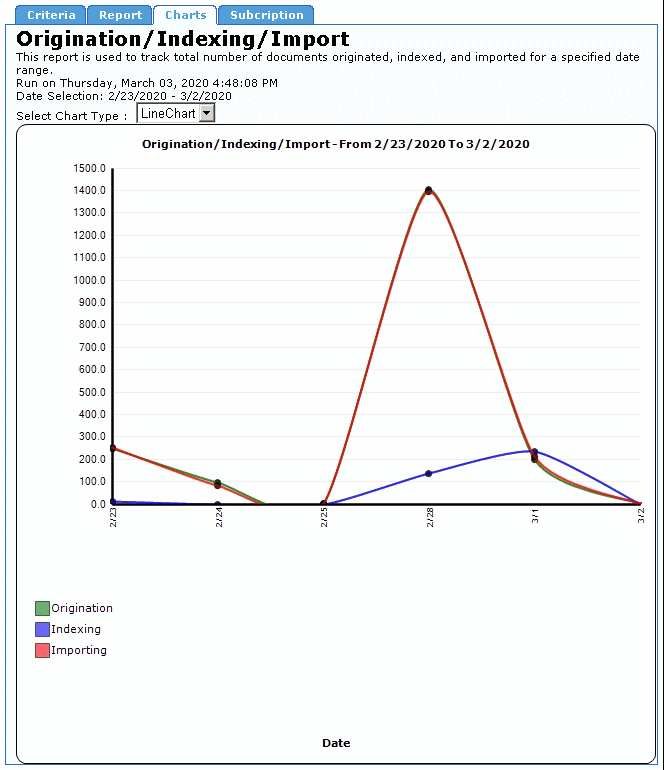
You can also view the data as a pie chart.
To do this, expand the Select Chart Type list and click PieChart.
Note: If you selected the Show Charts on Report Tab check box on the Criteria tab, the chart also appears on the Report tab.
12. To create another Origination/Indexing/Import Report, click the Criteria tab and configure the date and data type criteria for the new report, in the same manner as the previous report.
When returning to the Criteria tab after creating a report, all settings from that report are left unchanged, to facilitate making small changes to the report criteria.
To restore all report criteria to their default settings, click the Reset button, in the bottom-left corner of the tab.
The header of the Origination/Indexing/Import Report displays the report title, a description of the report, a time stamp indicating when the report was created, and the dates spanned by the report. The report data is presented in a table. The columns and rows of this table are described below.
|
Column Heading |
Description |
|---|---|
|
Document Class |
Document Classes selected for Report. |
|
Date |
The Date when the activities took place. |
|
Origination Count |
The number of documents originated in the TRANSFLO® system. |
|
Indexing Count |
The number of documents Indexed. |
|
Importing Count |
The number of documents Imported. |
The Origination/Indexing/Import Report contains rows displaying column totals for each Document Class individually and for all represented Document Classes as a whole.
These rows are described below.
|
Row Title |
Description |
|---|---|
|
Total for <DocClass> |
The sum total of all rows in the Page Count column for a specific Doc Class. |
|
Grand Total |
The sum total of all rows in the Page Count column for all Doc Classes. |
To create an Origination/Indexing/Import Report Subscription:
1. Click the Subscription tab.
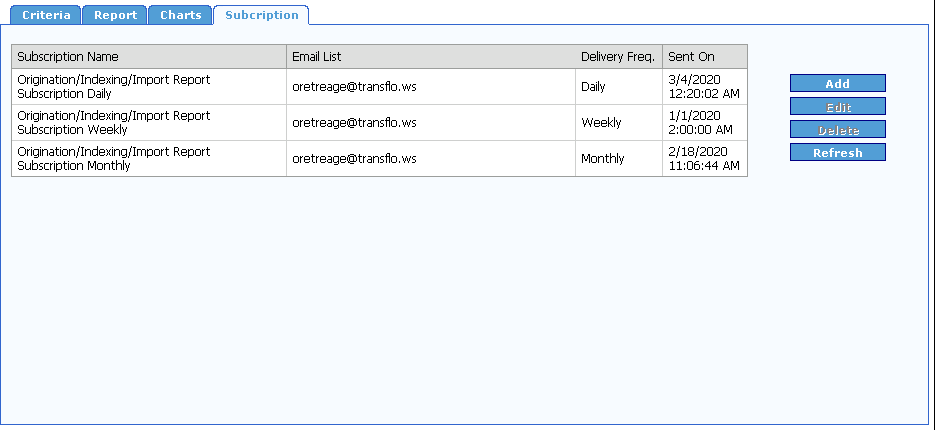
2. Click the Add button.
The Add Subscription form for the Origination / Indexing/ Import Report opens.
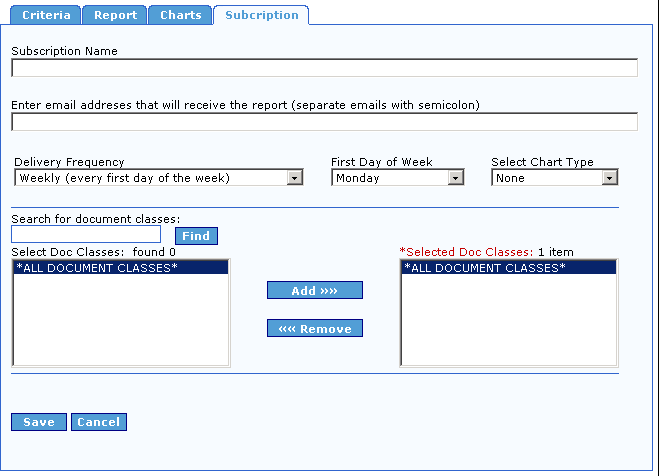
Note: This same form opens when you click the Edit button on the Subscription tab.
3. Enter a name for your report subscription in the Subscription Name box.
4. Enter the list of email addresses separated by semicolons (;) where you would like this report to be sent in the Enter email addresses that will receive the report (separate emails with semicolon) box.
5. Select how often you would like this report to be delivered from the Delivery Frequency drop-down.
Your options are Daily, Weekly, and Monthly.
If you choose Daily, the report will be sent every day with data from the previous day, and the report will show an hourly breakdown.
If you choose Monthly, the report will be sent the first day of every month for the previous month, and the report will show a daily breakdown.
6. If you selected Weekly from the Delivery Frequency drop-down, the First Day of the Week drop-down is visible.
Select the day of the week you would like the report to be emailed from the First Day of the Week drop-down.
The report will be for the previous week, the report will show a daily breakdown.
7. Select the type of chart you want to include with you report subscription from the Select Chart Type drop-down.
8. Select Document Classes in the same manner as described in Create an Origination/Indexing/Import.
9. To save the report subscription, click the Save button, otherwise click the Cancel button.
The report subscription is added to the Subscription list.
10. To delete a subscription from the list select it, and click the Delete button.
You will not be prompted to confirm you want to delete the subscription.
11. To update your list, click the Refresh button.