Check the Status of a Process in SPS Designer
Use this article to find a specific process in Synergize Process Server (SPS) Designer, open it, and check its status. SPS Designer is an automation tool typically installed on a separate Windows server; however, in some cases, it is installed on the same server as the Synergize application.
-
Connect to your SPS server.
-
Locate the Synergize Process Designer.msc configuration file using one of the following methods:
-
If you are logged in as administrator, you should see a Synergize Process Designer.msc - shortcut on desktop.
-
If there is no shortcut on desktop, try checking below folders to find Synergize Process Designer.msc file.
C:\Program Files\Microdea\Synergize Process Server (if your SPS version is 1.0.2.25 or lower)
C:\Program Files\Microdea\Synergize Process Designer (if SPS version is > 14.0)
-
-
To open SPS Designer, double-click on shortcut or Synergize Process Designer.msc.
-
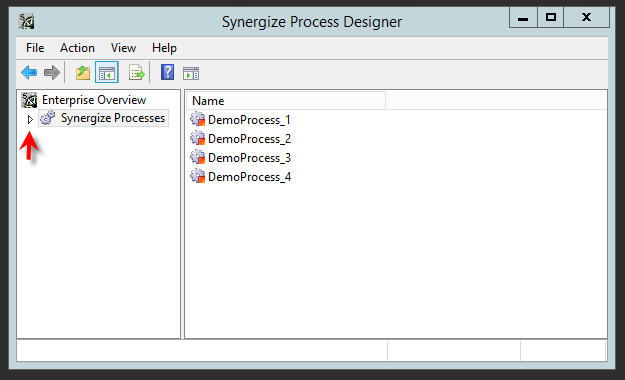
Click on expand arrow to see processes list.
-
If a process designer window is already open on the server, there is a good chance it was left open from long time and what you see on it may not be accurate.
-
Close the designer and open it again.
-
Closing the designer window does not mean you are stopping anything from running. Processes continue to function based on a service but not based on designer.
-
-
If you notice any error at this level, SPS service may not be running or having issues launching the designer.
To restart the SPS service, see Restart SPS Service Manually.
-
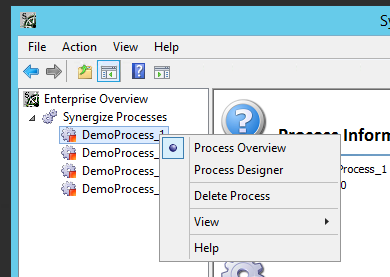
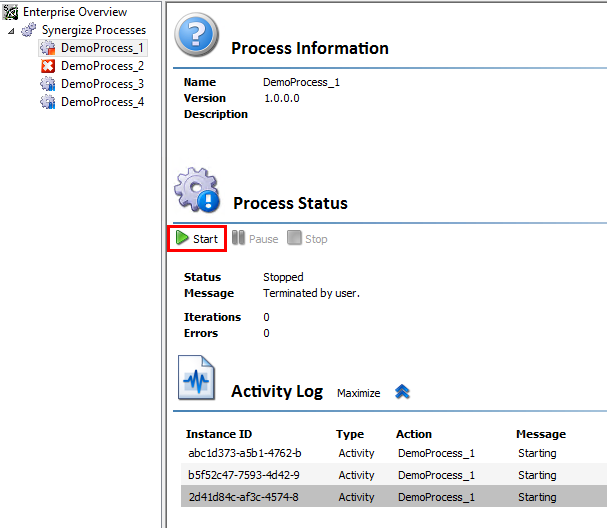
Right-click a process and choose Process Overview.
-
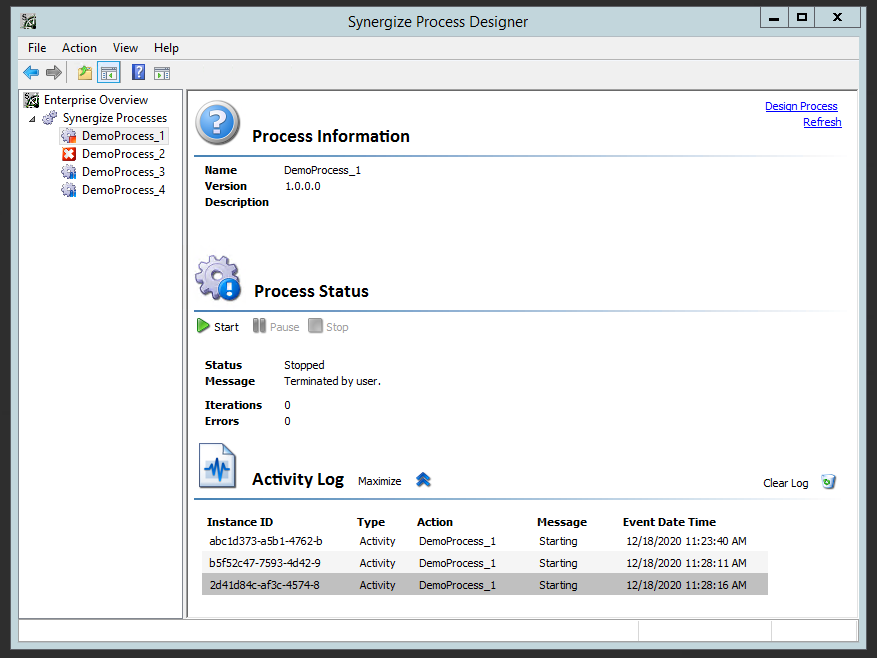
The Process Information section shows the name, version and description (if configured). The Process Status section shows the status of process. Available options are Stopped, Waiting, Running, Faulted and Disabled.
-
Stopped: If stopped, Message section shows the reason or you can check Activity log below to find out the reason.
-
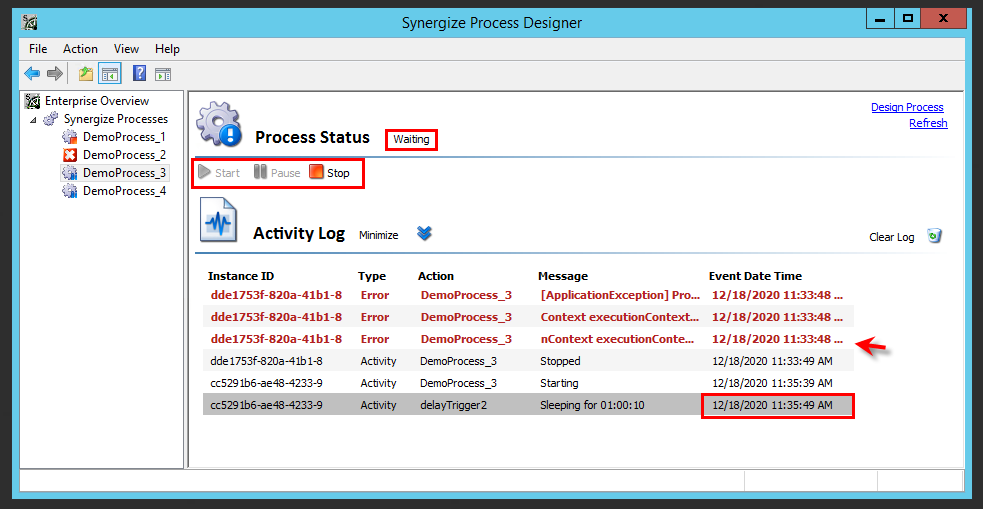
Waiting: Processes goes into waiting state between each trigger. Triggers can be anywhere from 1 seconds to 24 hours.
-
Running: Process is in middle of processing a document.
-
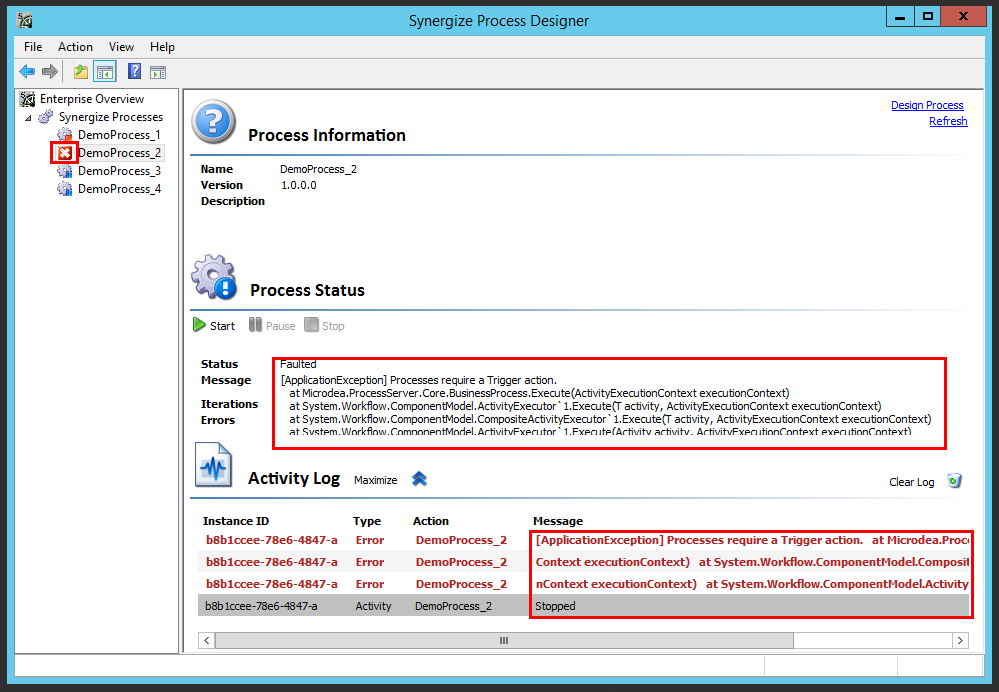
Faulted: An error occurred and process has stopped.
-
Disabled: A process that is not used and left disabled.
-
-
If the process is Stopped or Faulted, review the error message and click on start. If it continues to stop, contact support for further assistance.
-
A red square or red X on a process name means there is an error and process got Stopped.
-
Click on the process in Process Overview mode.
-
Look under activity log or message section to understand why its stopped or faulted.
-
You can choose to start the process back using above step. If you need help to investigate reason for errors, please log a support ticket.
-
-
If process you want to verify is already in running or waiting state, verify the timestamp on when it last ran. If time is close to current machine time, let the process run and monitor the messages to see if there are any red or green messages. Green are warnings and Red color messages are errors. If its stuck at any date and time, try to stop the process and start it or even try restarting whole service. If help required, please contact support.
-
Once you are done verifying, close the designer window before getting off server.