New! Transflo ATI Dashboards in Geotab
With your smart decision to purchase ELDs, cameras, and components from Transflo ATI and renew your annual subscription, you get access to a robust set of simple applications to help automate the display and management of your fleet telematics data including drivers, vehicles, HOS duty status, logs, and possible duty status violations. Many of these high-value add-ins are included at no extra cost. As a fleet manager, use this article to get up to speed on the core set of Transflo ATI add-ins and dashboards available to you inside your Transflo ATI Geotab portal.
As a fleet manager, ATI reminds you, if you are spending a lot of time managing common occurrences not addressed in one of our no-cost HOS+ Tools, reach out to our Sales and Support team.
"Geotab is good, definitely... but with ATI, it is great!"
— Danny Goldstein, Transflo ATI Customer Solution Architect
Note: For the best integrated experience with Geotab ELDs, ATI HOS add-ins, and the Transflo Mobile+ app, make sure your drivers are using version 6.0.1 of the Transflo Mobile+ app or a newer release.
As a reminder when using any HOS+ Tools, dashboards, or other add-ins inside the myGeotab portal, you can apply filters at both a global and local level.
-
You can apply global filters to focus on the same subset of data across multiple dashboard reports.
-
You can apply local dashboard-specific filters to reduce the amount of data in a given report and find the exact information you need.
Local filters vary by dashboard and are detailed in each separate section of this documentation. To learn how to apply global filters, see the Geotab documentation.
To understand the difference between local and global filters, a high-level example is included below:
-
Log in to myGeotab.
-
In the left navigation pane, click HOS+ Tools and then choose any report.
-
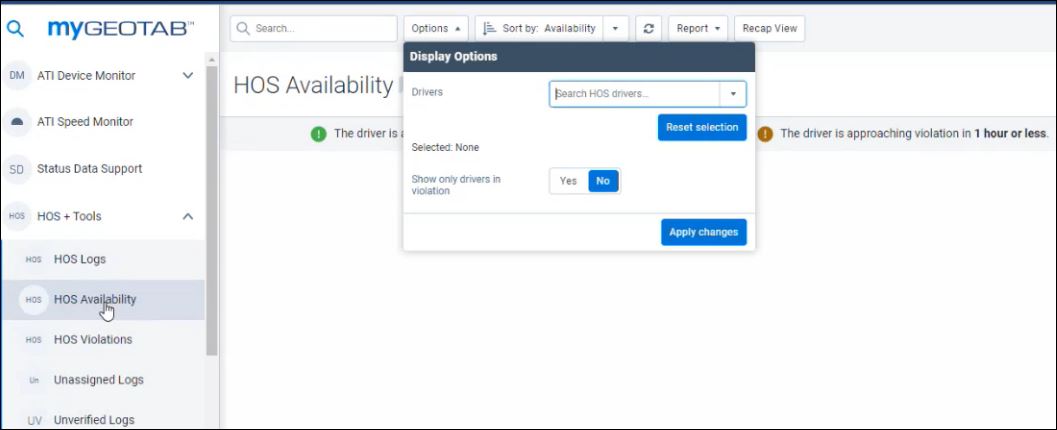
The Display Options you specify are an example of local filters. After you click Apply Changes, the filters you can apply to the resulting dashboard data are also local filters.
-
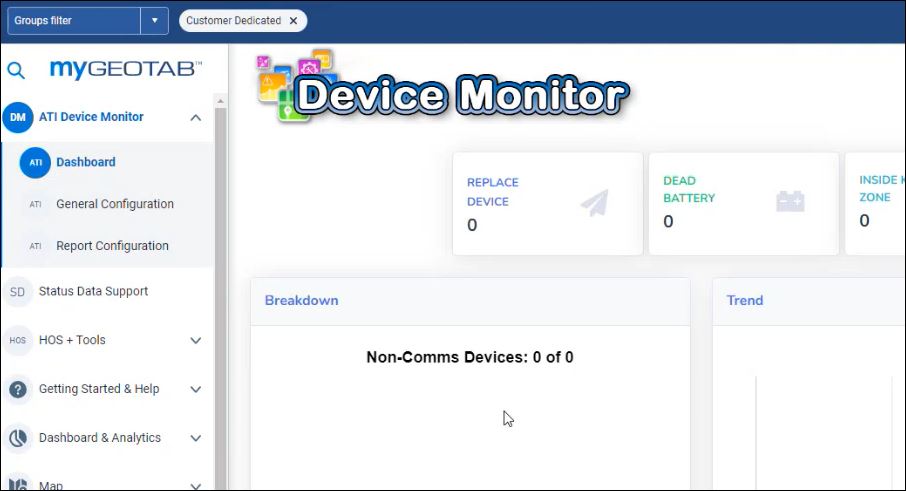
At top left, the currently applied global filter appears. In the example below, all reports are limited to just Customer Dedicated account data. To remove a global filter, click X Remove.
-
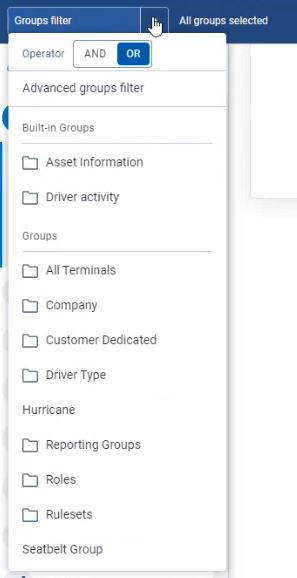
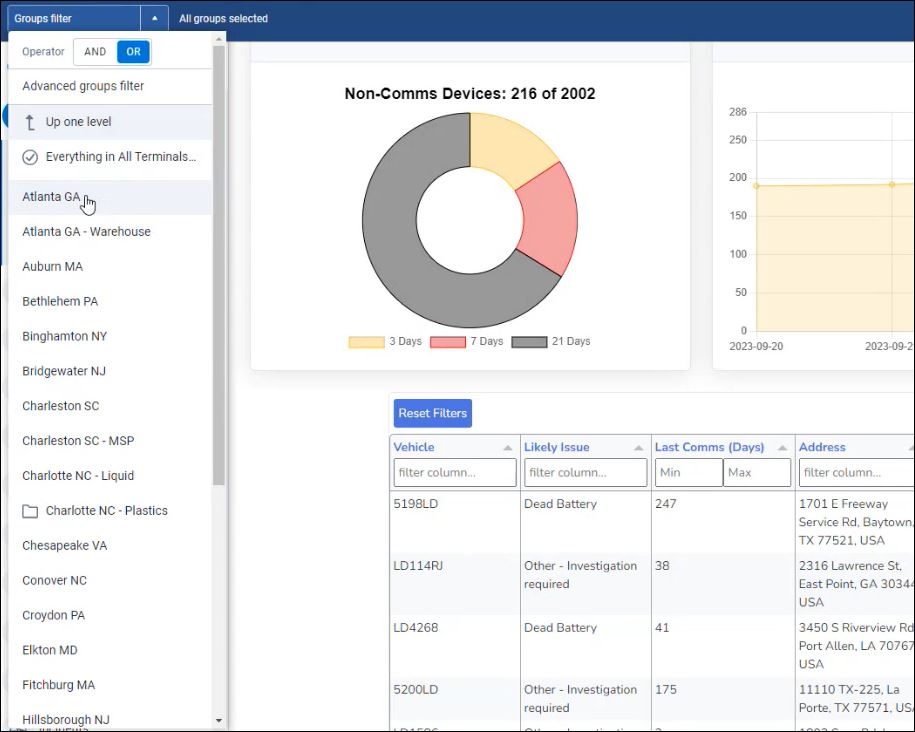
To apply a global filter to one or more reports, click Groups Filter at top left.
-
Set the logical operator to AND or OR.
-
AND: Use the AND operator to search for a very limited result set. For example, a global filter on all trucks that are in Georgia AND Terminal 2 AND blue AND model year 2022 will yield relatively few results.
-
OR: Use the OR operator to expand or loosen the filter criteria. For example, a global filter on all trucks that are in Georgia OR Texas OR Ohio OR Terminal 1 OR Terminal 2 OR blue OR 2022 is going to yield a relatively greater number of results.
-
-
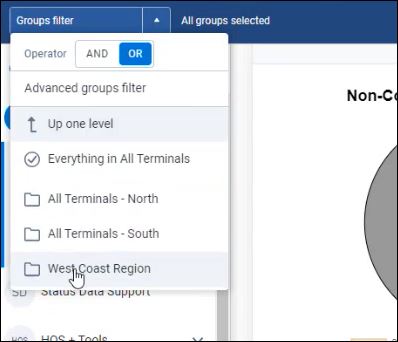
Select one or more pre-defined groups at one or more levels.
-
In the following example, the user applies a global filter to reduce the scope of the dashboard report to cover only the Atlanta, GA site under All Terminals -South. In the resulting data table, notice the local filters at the top of each column.

Tip: Global filters can speed report performance because they reduce the volume of data returned. Without a global filter, all groups selected appears at the top and the report scope is universal.
Your Transflo ATI Telematics subscription includes a basic set of add-ins that offer immediate value at no added cost to you. Similar to the driver experience in the Transflo Mobile+ app where all essential features including HOS, loads, and doc scanning are available in one Transflo app, the ATI HOS+ Tools fleet manager experience in Geotab also offers a complete solution where the power of ATI, Geotab, and Transflo telematics converge.
As a fleet manager, you can access ATI add-ins, dashboards, and reports inside myGeotab. A core set of these tools is available at no charge. Others might require small additional charges to your fleet that typically pay for themselves in terms of return on investment, time-savings, and value.
-
Log in to myGeotab.
-
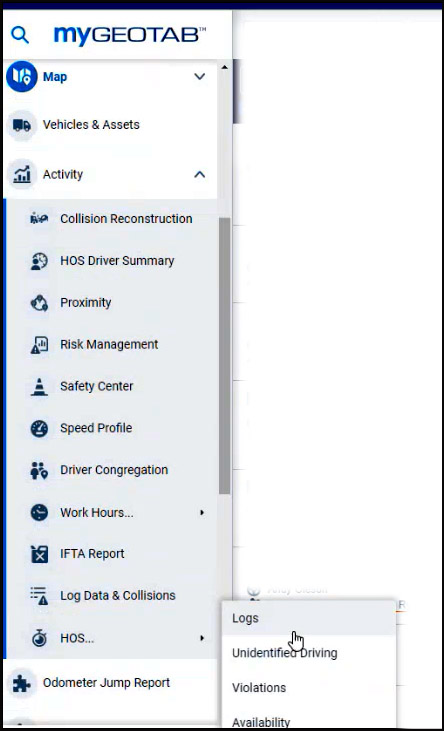
To understand how Transflo ATI improves your fleet management experience, navigate to the traditional set of dashboards by clicking Activity, HOS, and then choosing Logs, Unidentified Driving, Violations, or another option.
-
As a more convenient alternative, instead of clicking the Activity node in the navigation pane in myGeotab, click HOS+ Tools. From here, higher up in the navigational tree, you can more easily select from a set of powerful Transflo ATI dashboards including HOS Logs, HOS Availability, HOS Violations, and more.
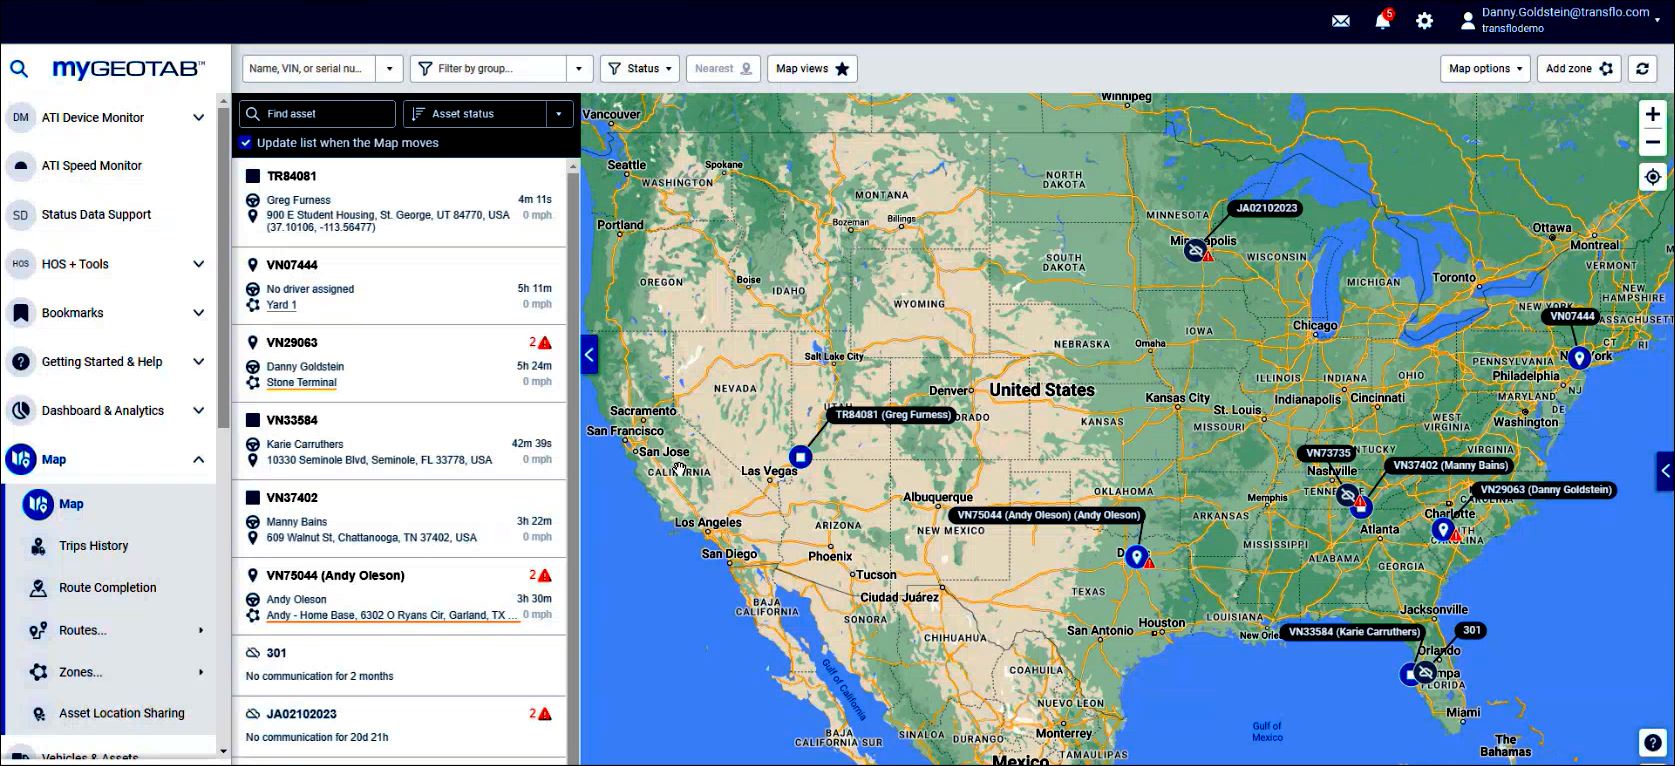
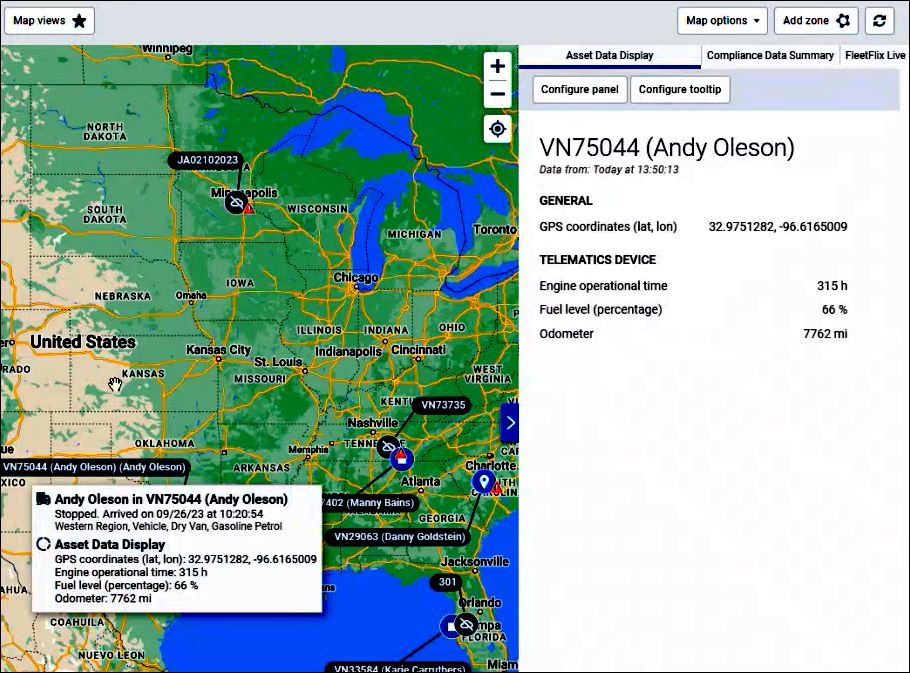
With driver app location tracking or ELD GPS features or a combination of both, you can view vehicles, assets, and drivers on a map.
-
Log in to myGeotab.
-
In the left navigation pane, click Map.
-
Apply one or more filters and zoom in or out as needed.
-
To get updated asset tracking data, click on a vehicle.
Other options and data include the following:
- GPS lat and long coordinates
- Engine operating time
- Fuel level percentage
- Odometer
- Compliance Data Summary
- Add Custom Zones
- Map Options
- Live Camera System Views (FleetFlix and other vendors).
To view standard Geotab HOS Logs for one or more drivers by date or date range, use the standard ATI HOS Logs dashboard under HOS+ Tools.
-
Log in to myGeotab.
-
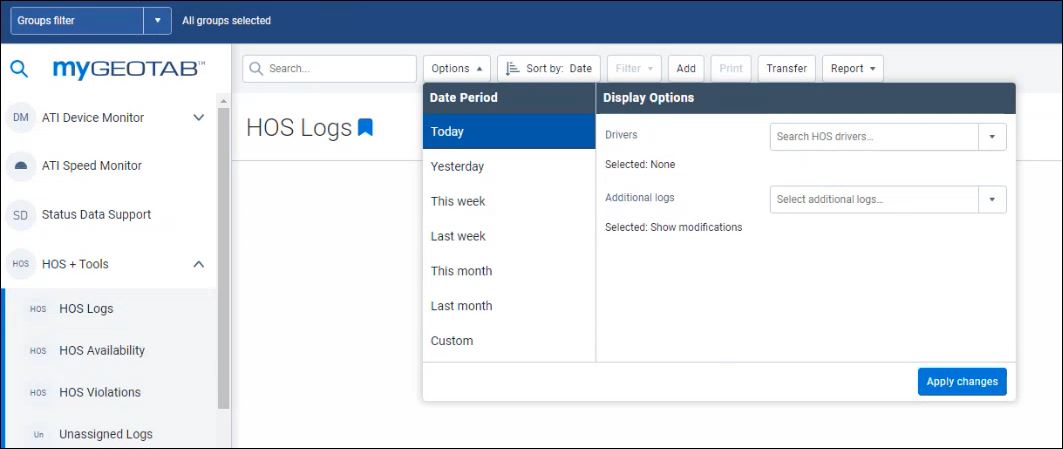
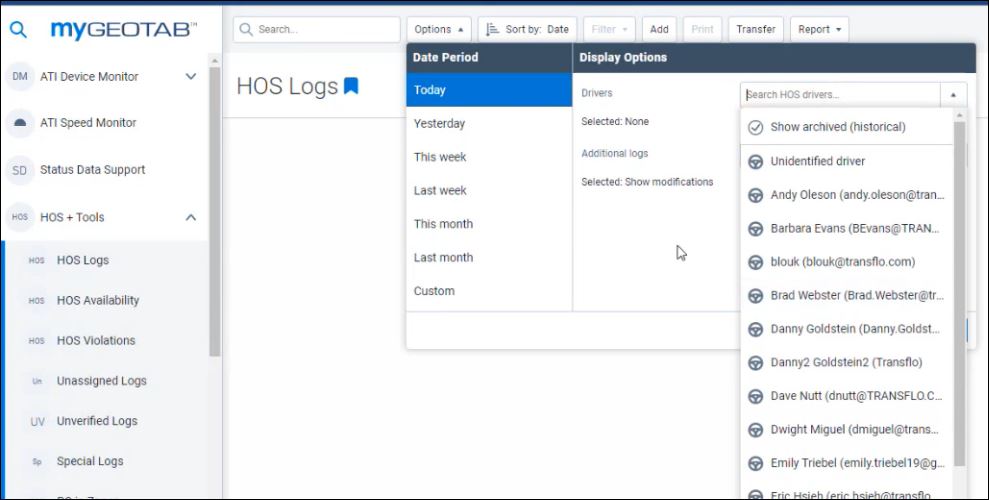
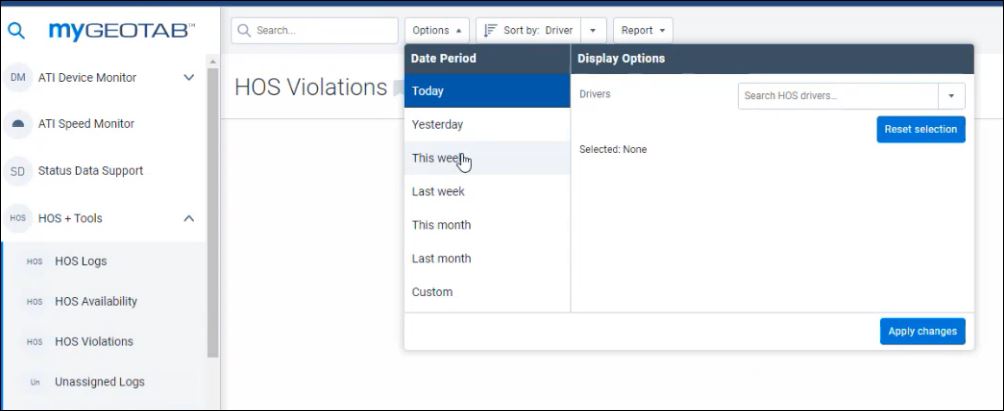
In the left navigation pane, click HOS+ Tools and then choose HOS Logs.
-
Apply one or more of the following options to filter the resulting data:
-
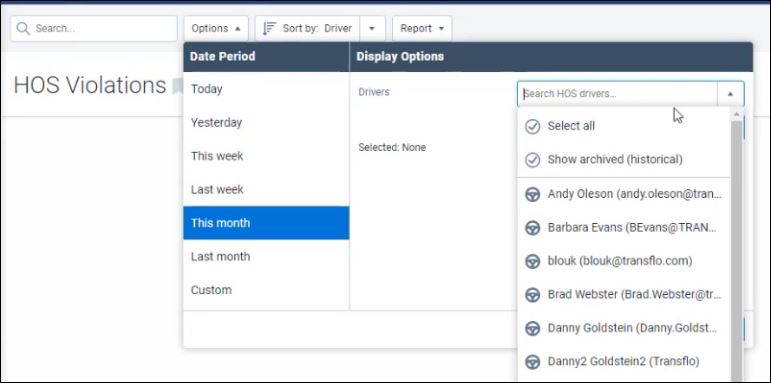
Under Date Period, select today, yesterday, this week, or another range. To define your own date range, click Custom.
-
In the Drivers field, select one or more drivers.
-
Click Apply Changes to apply your search filter criteria to the resulting data in the dashboard. Review the resulting logs by driver and by date.
-
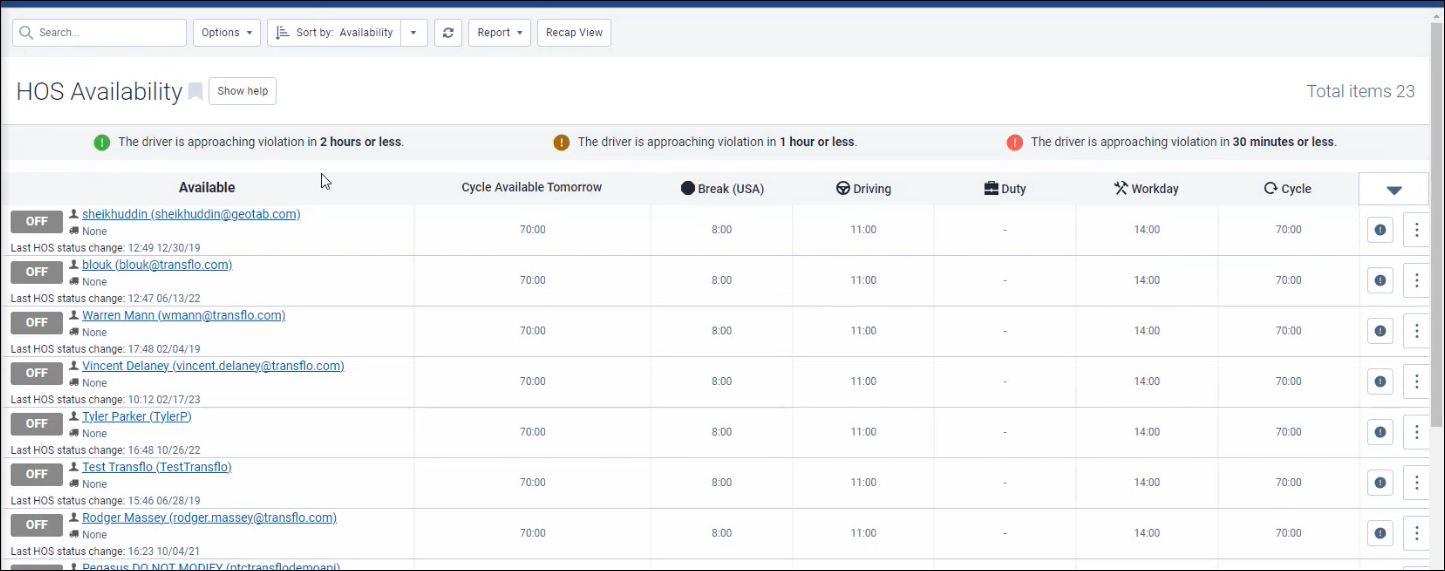
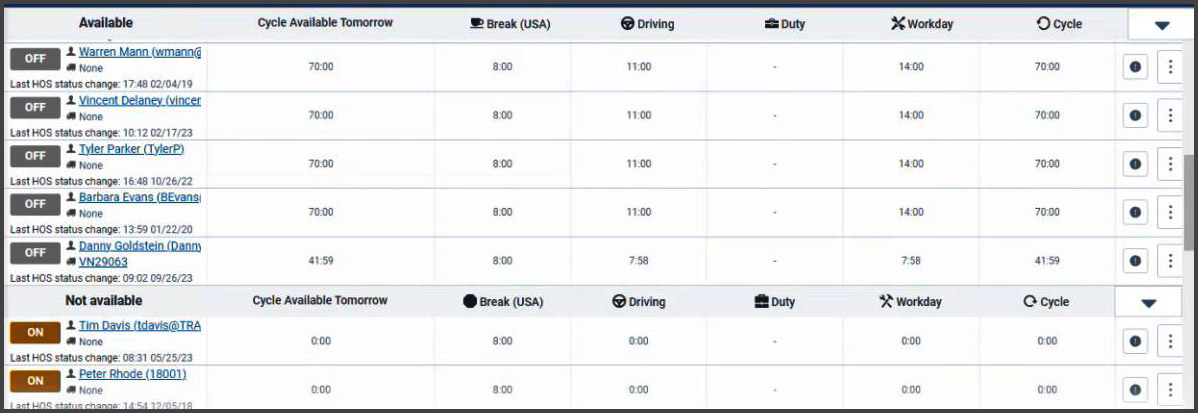
As a fleet manager, use the HOS Availability dashboard to get the latest status of each driver and track which drivers have available drive time and which drivers are in violation (non-compliant HOS duty status).
-
Log in to myGeotab.
-
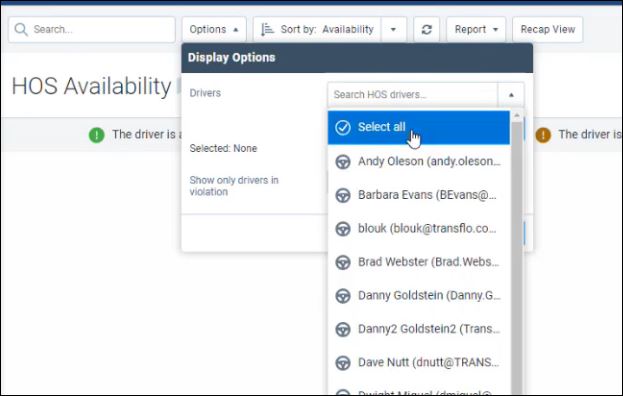
In the left navigation pane, click HOS+ Tools and then choose HOS Availability.
-
Apply one or more of the following options to filter the resulting data:
-
Review the resulting HOS Availability dashboard.
-
Sort the data or scroll down to determine who has available hours under the Cycle Available Tomorrow column.
-
Log in to myGeotab.
-
In the left navigation pane, click HOS+ Tools and then click HOS Violations.
-
Apply one or more of the following options to filter the resulting data:
-
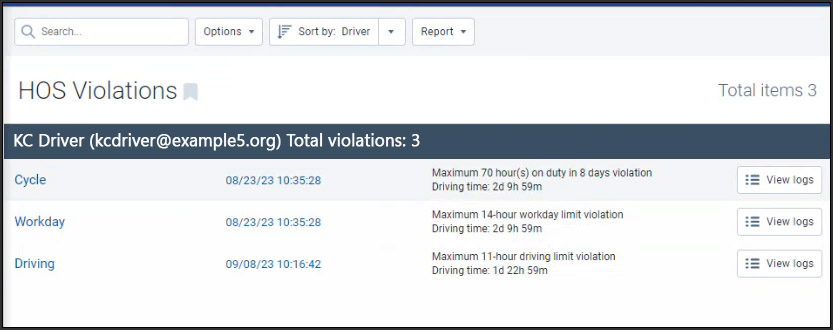
Review the resulting list of HOS violations for each driver. The dashboard uses business logic behind the scenes for you to determine what type of violation has occurred based on the current ELD HOS rule set. Examples of HOS violations include cycle, workday, and driving time violations. Typically, when an established maximum time limit is exceeded, a violation occurs. These time limits are based on rule sets and established transportation safety laws.
-
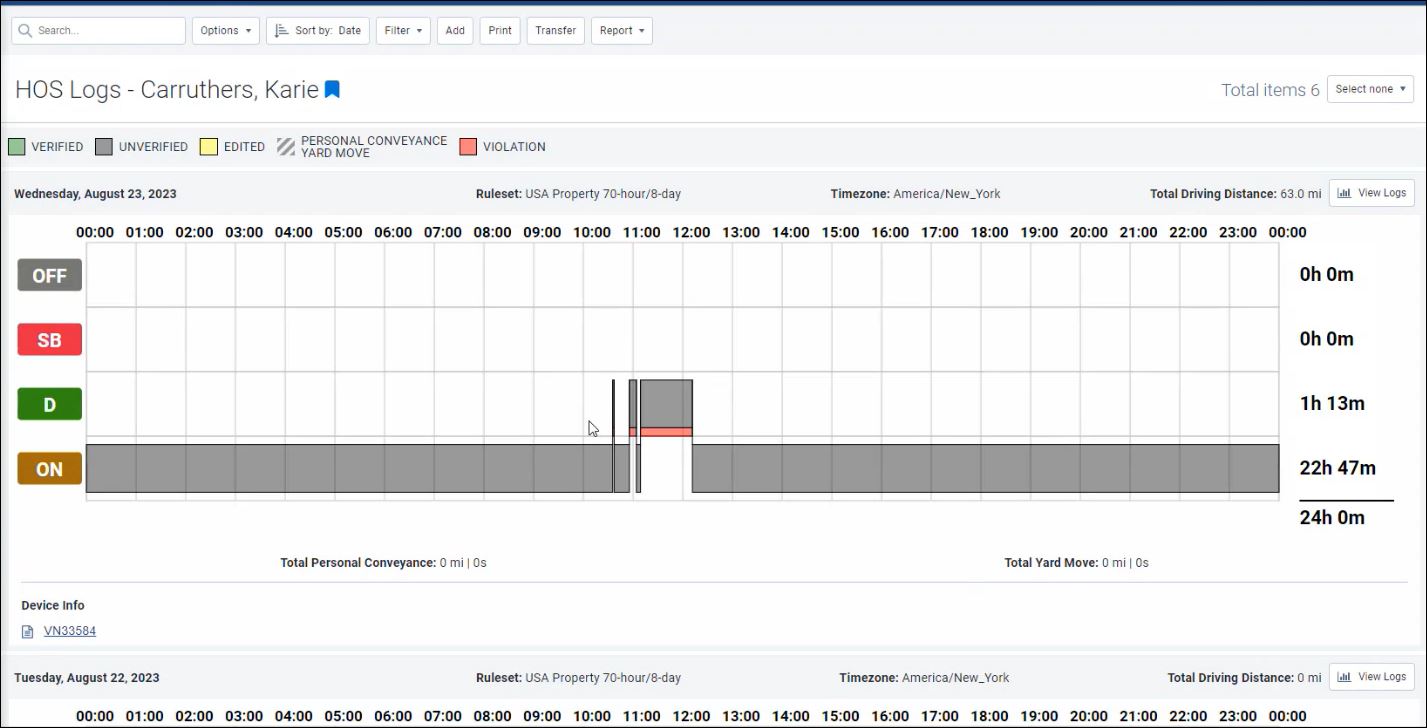
To drill into the details behind a violation, click View Logs.
-
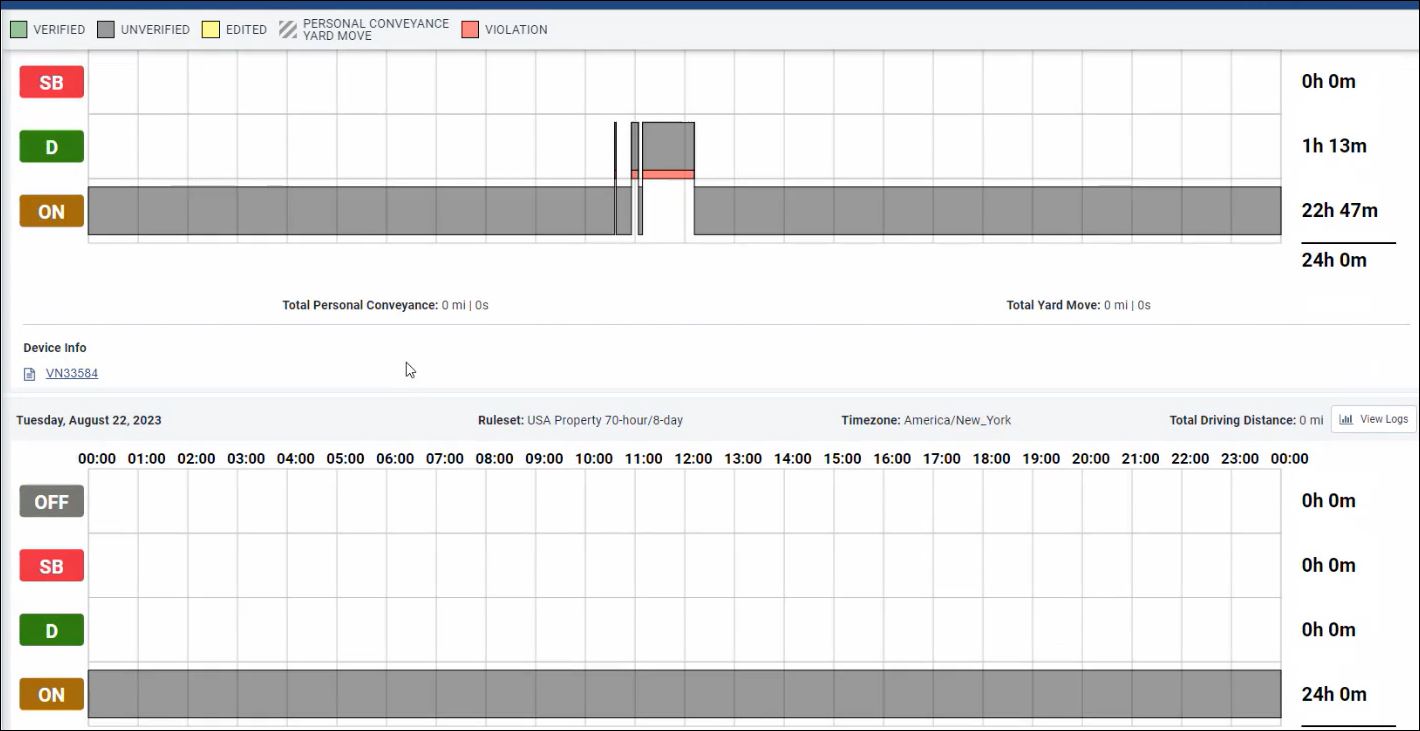
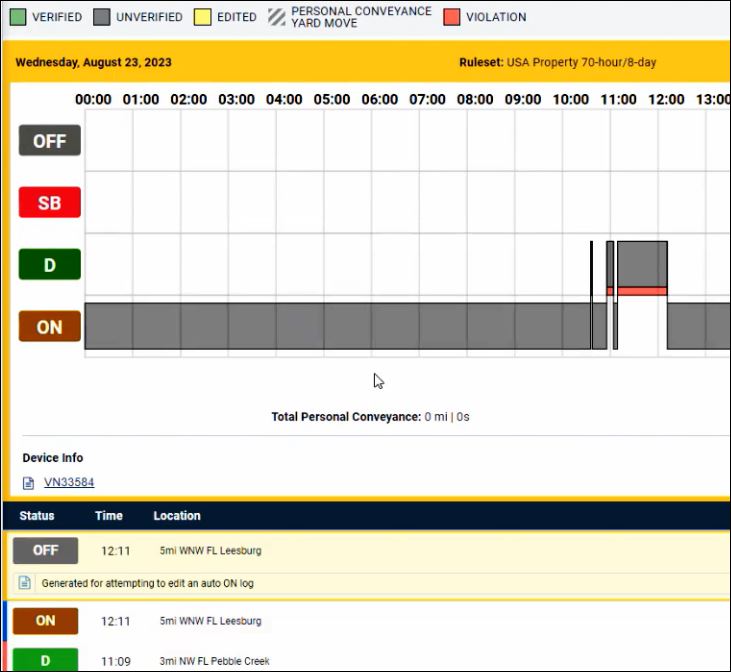
In the following example, the Drive (D) time for this driver around 11:00 AM Wed Aug 23 was in violation.
-
Scroll the logs down for this driver to show the previous day, Tuesday Aug 22 where it is now easy to see that the ELD was reporting ON duty status for a large block of time (over 24 hours). In this scenario, the driver forgot to go OFF duty.
-
To drill into the logs and attempt to resolve the violation, go back to the ON duty bar or row in the logs for Wed Aug 23 (the day when the violation occurred). Click anywhere on the gray bar.
-
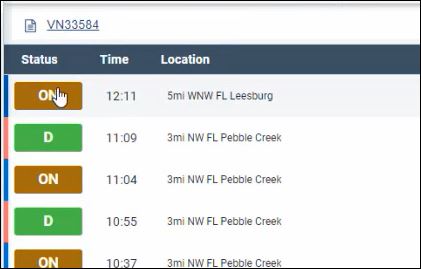
The dashboard now shows the vehicle and multiple detailed status, time, and location entries. Click the ON duty row.
-
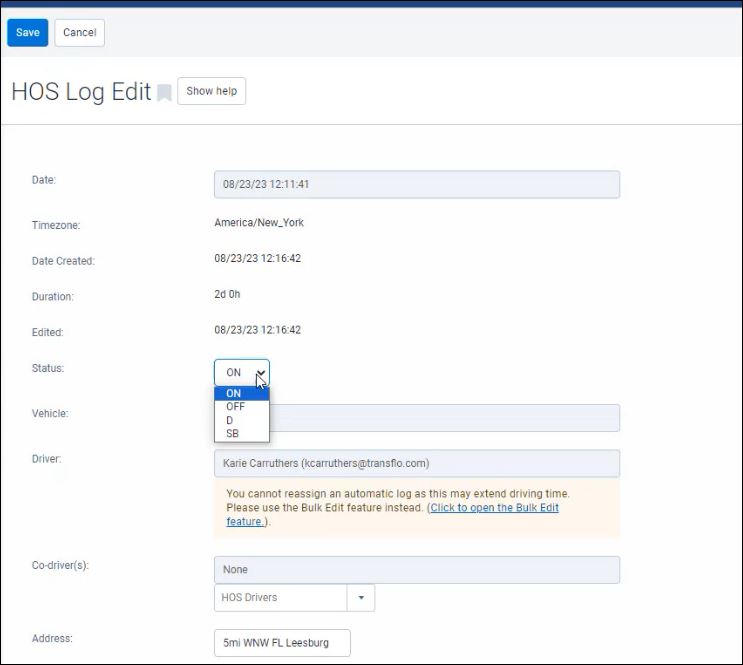
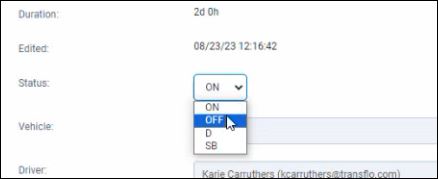
On the resulting HOS Log Edit page, change the Status field value from ON to OFF.
-
After you choose OFF, click Save.
-
In the Create a new Duty Status Log? message box, click Yes. You cannot edit an automatic ON duty status log; however, you can create a new duty status log entry following this one with your changes. Remember, in this scenario, the driver ELD put the driver in automatic ON duty status when the driver moved the vehicle days ago and forgot to go OFF duty.
-
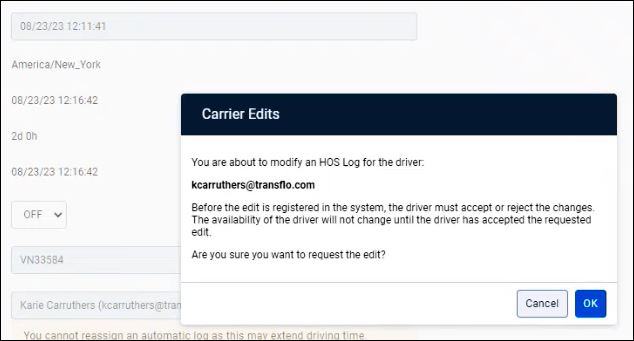
In the Carrier Edits message box, click OK.
-
Back on the logs, your new edited OFF duty entry has been generated in response to an attempt to edit an automatic ON log entry. The entry is pending until the driver accepts the edit in their Transflo Mobile+ or HOS app.

Tip: Remind your drivers with HOS violations that their violation status and availability cannot be corrected until they accept the edit request on their phone or tablet running Transflo HOS or Transflo Mobile+.
-
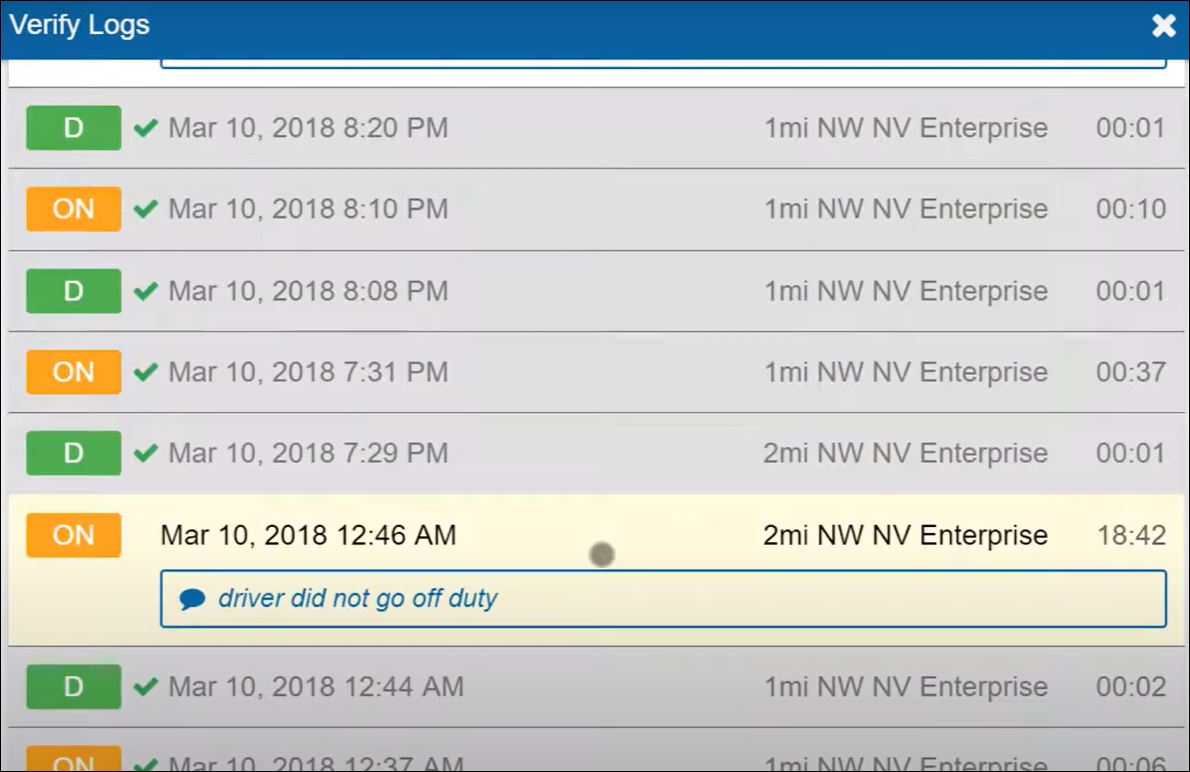
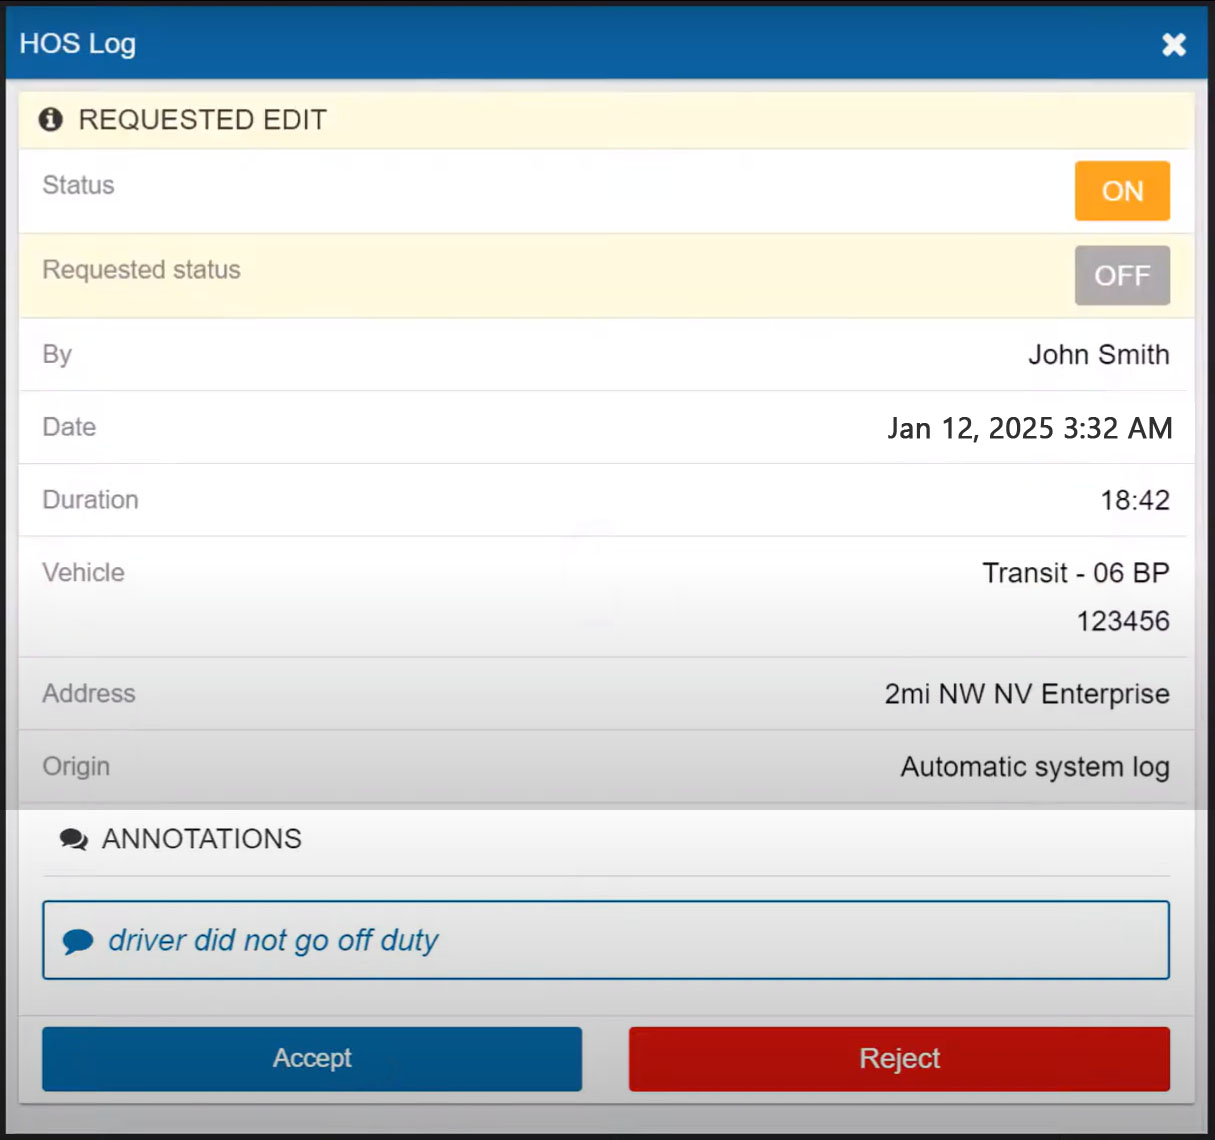
As a fleet manager, you need to know what your drivers will see in their mobile app when you make a change such as fix a violation, add an annotation, or assign a driver to an unassigned driver log. Your driver receives a prompt to verify their logs and accept or reject any annotations. In the driver app, the entries that need attention are highlighted with a light yellow background.
-
When the driver taps on the log, they can tap Accept or Reject. In the following example, a driver forgot to go OFF duty so their ELD put them in HOS violation status. The fleet manager made an HOS log edit to change the status from ON to OFF. The driver taps Accept and the logs are corrected.

Tip: Each driver, operator, owner, and carrier fleet establishes their own standard policies and procedures. For example, in some fleets, drivers alert their fleet manager when they first become aware of a discrepancy in their logs. In other fleets, one or more fleet managers are responsible for fixing problems without any additional communication with drivers, instead relying entirely on the automation between the Transflo ATI myGeotab data and the Transflo mobile app for drivers.
As a fleet manager, use this dashboard to work down the list of unassigned log entries. To pass an audit, you want to eliminate unassigned logs or, at minimum, annotate them (for example, annotate a few 10-minute unassigned activities as yard moves) to reconcile your logs.
-
Log in to myGeotab.
-
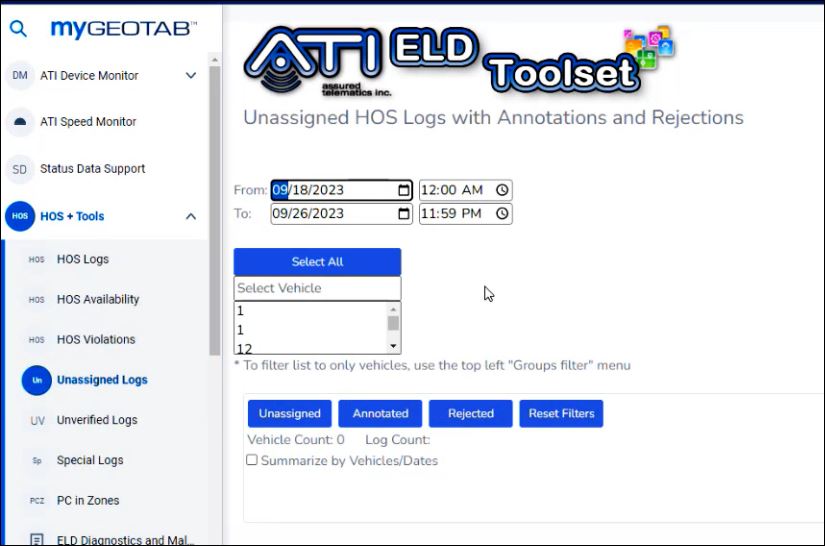
In the left navigation pane, click HOS+ Tools and then click Unassigned Logs.
-
Apply one or more of the following options to filter the resulting data:
-
Use the From and To date and time fields to set a valid date range for the dashboard report.
-
In the Select Vehicle field, select one or more vehicles. To include all vehicles in the dashboard report, click Select All.
-
Click Unassigned.
-
(Optional) To clear your filter data and start over, click Reset Filters.
-
-
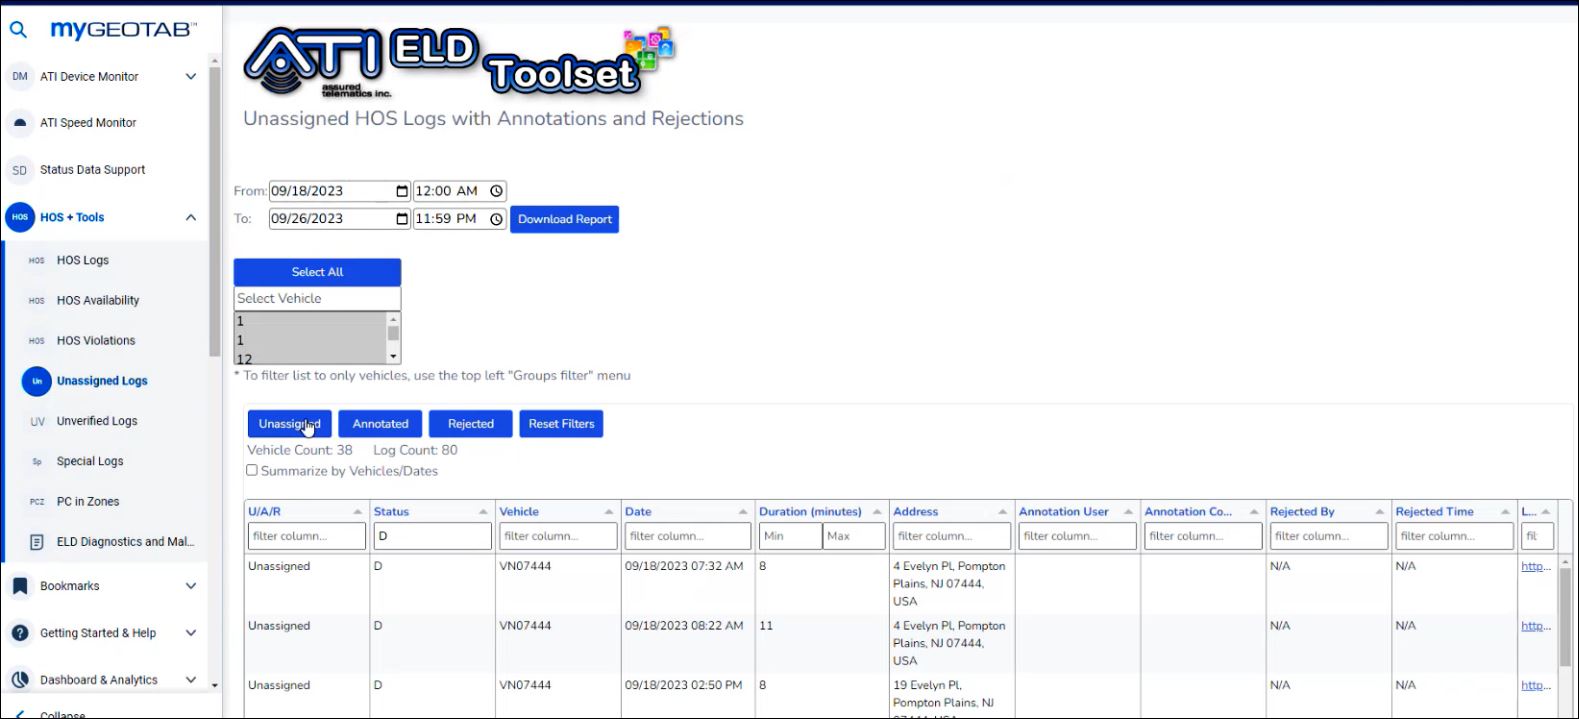
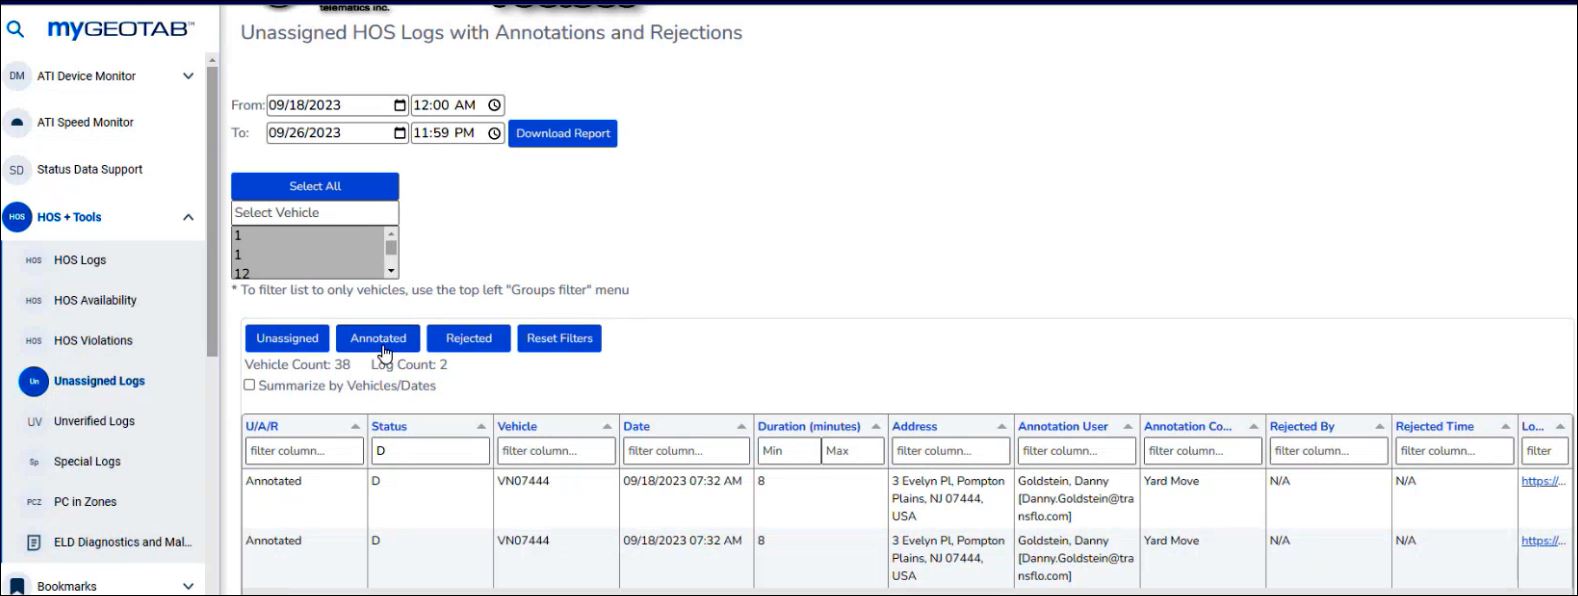
The report shows a list of all vehicles driven without an assigned driver including date, time, driving time duration, and address (based on last known location tracked). In the following example, a fleet of 38 trucks were driven 80 times without an assigned logged in driver over the nine (9) day period from Sep 18 to Sep 26.
-
(Optional) To export the dashboard to a spreadsheet file, click Download Report.
-
To resolve an unassigned log entry (required for audit compliance), click on a row in the dashboard.
-
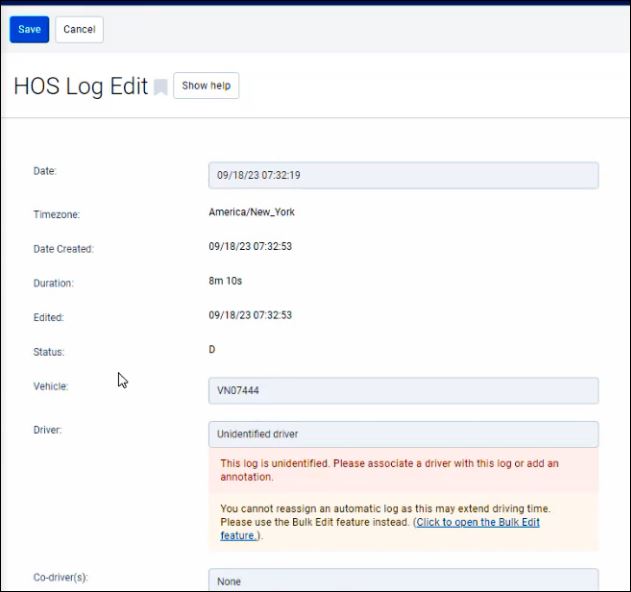
On the resulting HOS Log Edit page, associate a driver with this log. In the Driver field, change Unidentified Driver to a valid driver in the list. Click Save.
-
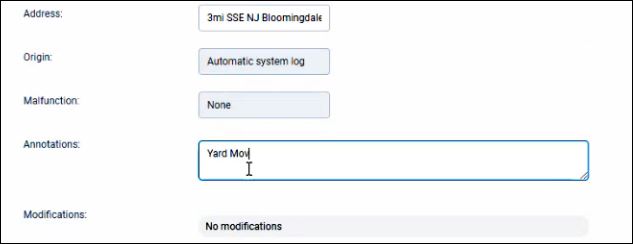
If you cannot determine a valid driver or the driver rejects the request, make an annotation. For example, enter Yard Move. Click Save.
-
To filter the Unassigned Logs dashboard report to show only the rows with annotations, click Annotated. In this example, the same fleet of 38 vehicles for the same date range shows only two unassigned log entries with annotations.
-
As a fleet manager, you need to know what your drivers will see in their mobile app when you make a change such as fix a violation, add an annotation, or assign a driver to an unassigned driver log. Your driver receives a prompt to verify their logs and accept or reject any annotations. The entries that need attention are highlighted with a light yellow background.
-
When the driver taps on the log, they can tap Accept or Reject. In the following example, a driver forgot to go OFF duty so their ELD put them in HOS violation status. The fleet manager made an HOS log edit to change the status from ON to OFF. The driver taps Accept and the logs are corrected.
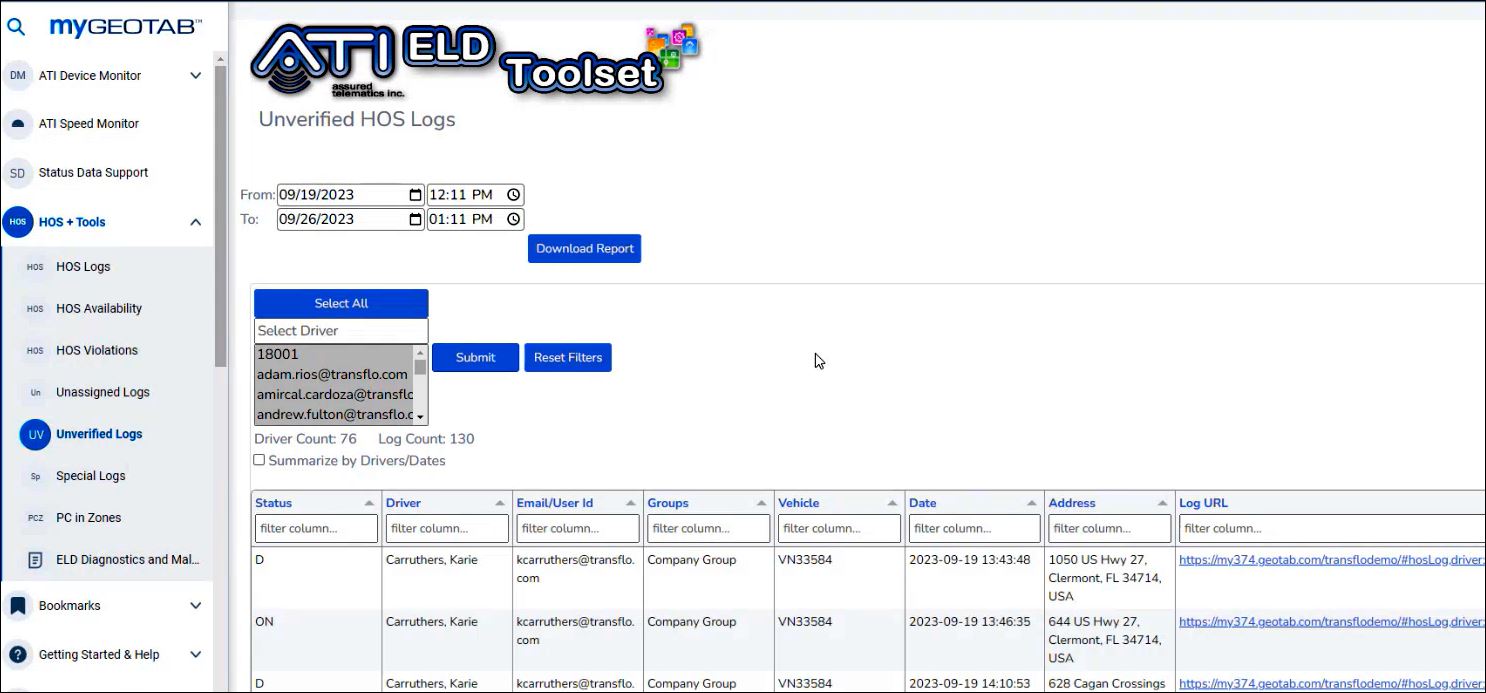
Because Geotab Drive, the Transflo HOS app, and HOS features inside the Transflo Mobile+ app all store driver logs for just the last two weeks at any given time, it is important for drivers to verify their logs in a timely manner (hint: make an effort to do it daily). As a fleet manager, you can remind one or more drivers with unverified HOS logs to "go into your app and sign your logs." After each rolling two-week period, drivers will no longer have immediate direct access to their logs. Instead, they will have to go into the myGeotab HOS portal themselves or ask their fleet manager for assistance in verifying their logs.
-
Log in to myGeotab.
-
In the left navigation pane, click HOS+ Tools and then click Unverified Logs.
-
Apply one or more of the following options to filter the resulting data:
-
In the From and To date and time fields, set a valid date range for the dashboard report.
-
In the Select Driver field, select one or more drivers. To include all drivers in the dashboard report, click Select All.
-
Click Submit.
-
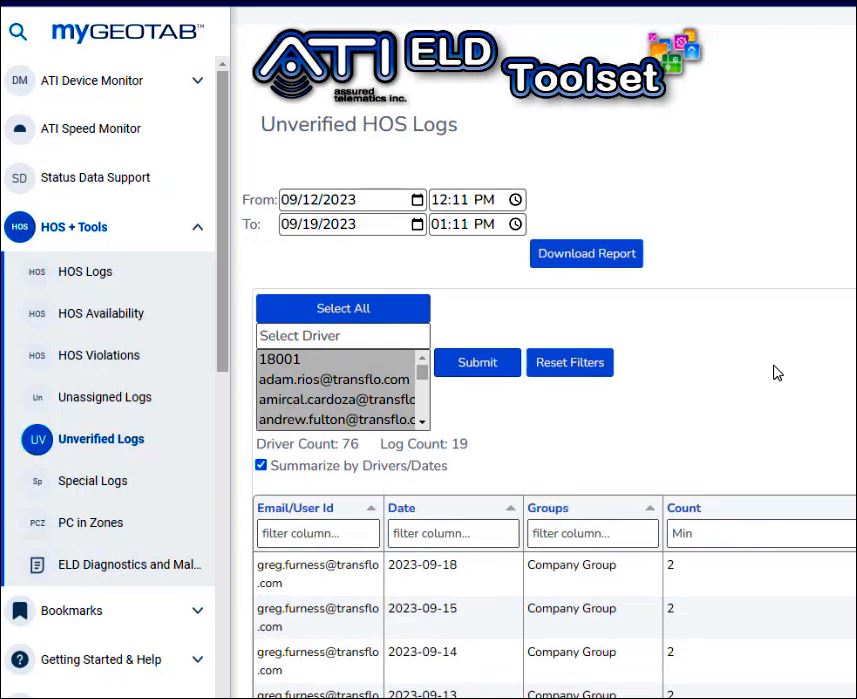
(Recommended) To view the data in groups by driver and then by date, select the Summarize by Drivers/Dates option. As a fleet manager, make it a priority to remind the drivers that show multiple days of unverified logs and also those with a high total in the Count column.
-
-
(Optional) To clear your filter data and start over, click Reset Filters.
As a fleet manager, you can examine various exemptions to a strict hours-of-service (HOS) policy where occasional permitted status values other than OFF, ON, Drive (D), and Sleeper Berth (SB) are used by drivers. For example, generally speaking, an OFF-duty driver should not be driving. So fleet managers are going to want to know why a given ELD in a truck might be reporting time or miles driven.
-
If a log shows a relatively small number of miles driven for a short duration with a PC, YM, or other allowed exemption status, the event and log are likely acceptable valid instances and are typically annotated and safe to allow and ignore. Yard Move (YM) indicates a driver was ON or OFF duty but drove within a shipping yard (for example, to pick up or drop off palettes). Personal Conveyance (PC) indicates a driver is OFF duty and getting lunch or driving home or to a hotel.
-
If a log shows a relatively large number of miles driven, longer durations, or a repeated pattern of driver abuse under a PC, YM, or other exemption status, the event and log could represent infractions subject to verbal warnings, written notifications, or disciplinary action.

Tip: When a driver experiences a day or two with HOS exemptions and no sustained pattern of abuse, it could just be a technical glitch, a training issue, or a bad day.
-
Log in to myGeotab.
-
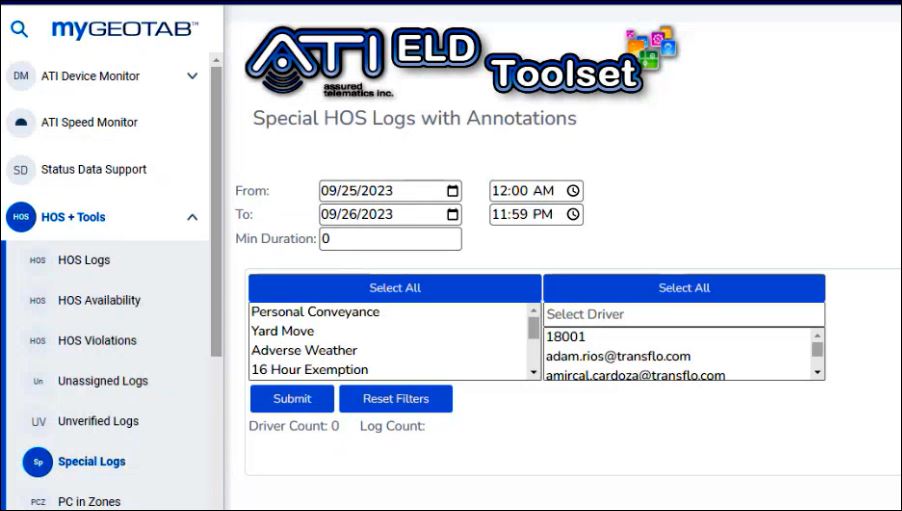
In the left navigation pane, click HOS+ Tools and then click Special Logs.
-
Apply one or more of the following options to filter the resulting data:
-
In the From and To date and time fields, set a valid date range for the dashboard report. If your driver and special log counts are typically low, you might run this report every month or every two weeks. To resolve more frequent issues, run the report every week or every few days to observe possible recurring patterns.
-
In the Min Duration field, leave the default value of 0 or set your own minimum duration. For example, your company might require you to identify and enforce a policy where certain exemptions must not exceed 60 minutes.
-
In the drop-down list of exemptions, click Select All or select only the exemption types you want to examine. Hold down the Ctrl key to click more than one value in the list.
Exemptions:
-
Personal Conveyance (PC)
-
Yard Move (YM)
-
Adverse Weather
-
16-Hour Exemption
-
Exemption Off Duty Deferral
-
Authority Status
-
Sleeper Berth Status
-
Wait time Oil Well Driver Status
-
Work Exemption (permitted personal activity)
-
-
In the Select Driver field, select one or more drivers. To include all drivers in the dashboard report, click Select All.
-
Click Submit.
-
-
(Optional) To clear your filter data and start over, click Reset Filters.
-
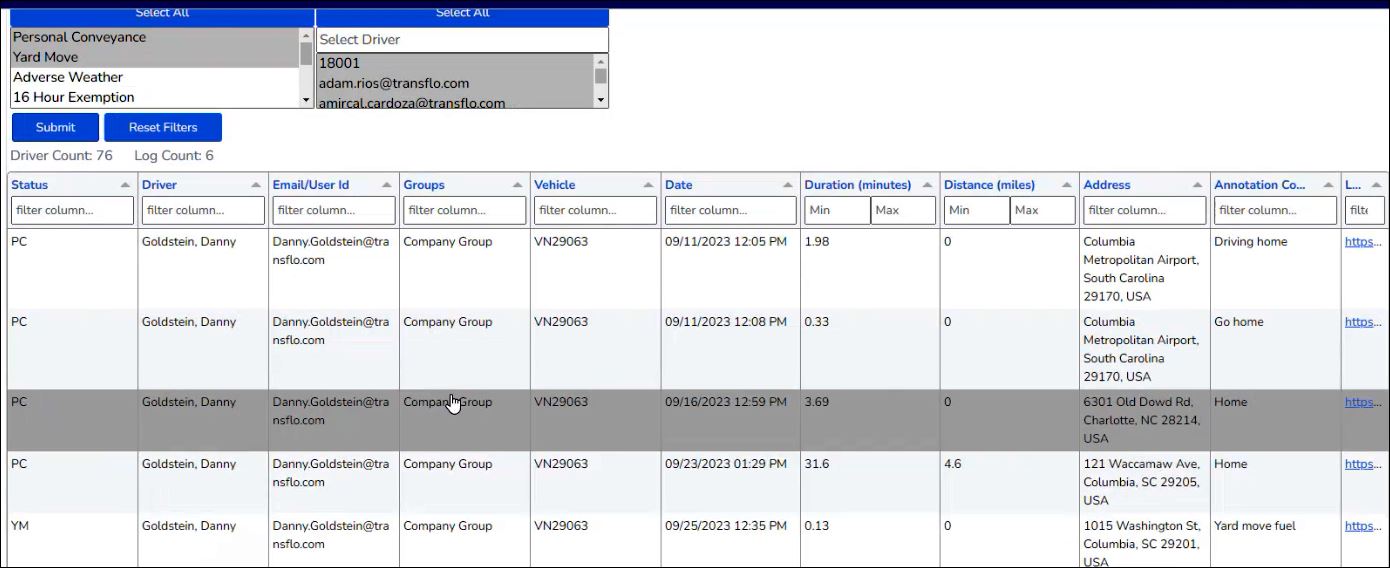
In the following example, the user (fleet admin) selected all drivers and only the PC and YM exemption types. Because only six (6) logs were recorded where at least one of 76 drivers moved a vehicle while in OFF duty status, the fleet manager is not overwhelmed by all the data and is not concerned with these potential infractions. All the exemptions were properly logged as PC or YM, with short durations registering 0 miles, and all were properly annotated. As a fleet manager, look for exemptions that do not show a proper status such as OFF, show long time durations, and no annotations to explain.

Note: Can you identify the one exemption in the example screenshot above that might represent a potential problem? That's right, the PC log of 9/23 could represent a driver attempting to extend his OFF duty status with some non-compliant driving time. The ELD recorded another 4.6 miles of driving for over 31 minutes.
-
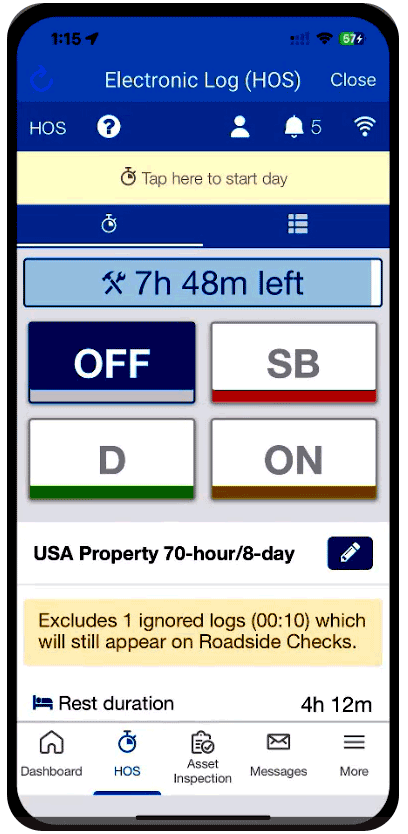
As a fleet manager, it is important to recognize what your drivers must be advised to do in their HOS app. After logging in, a driver can choose Tap here to start day and typically selects OFF, ON, D, or SB for their current HOS status throughout a typical workday.
-
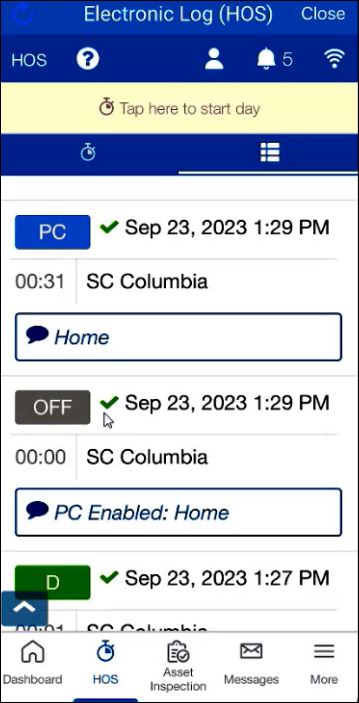
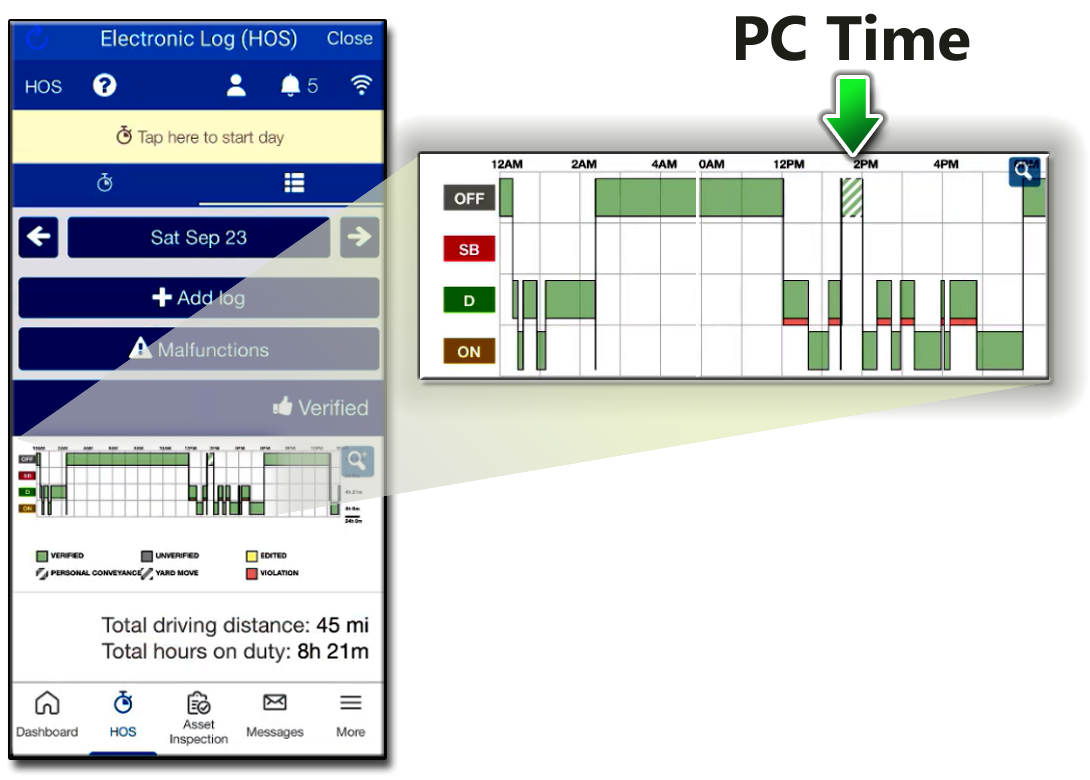
In the following example, the driver has properly annotated their logs to make it clear when they went OFF duty, enabled PC mode to drive home, and then drove for 31 minutes off duty in PC mode to their home.
-
Drivers can track their own status on their mobile device (tablet or smartphone). The following example shows a valid ON duty log, some driving (D) in violation, with a brief switch to PC mode (for example, to drive to get lunch). When the driver goes into PC, their app requires an annotation, and then automatically switches them to OFF duty and records PC in the special logs.
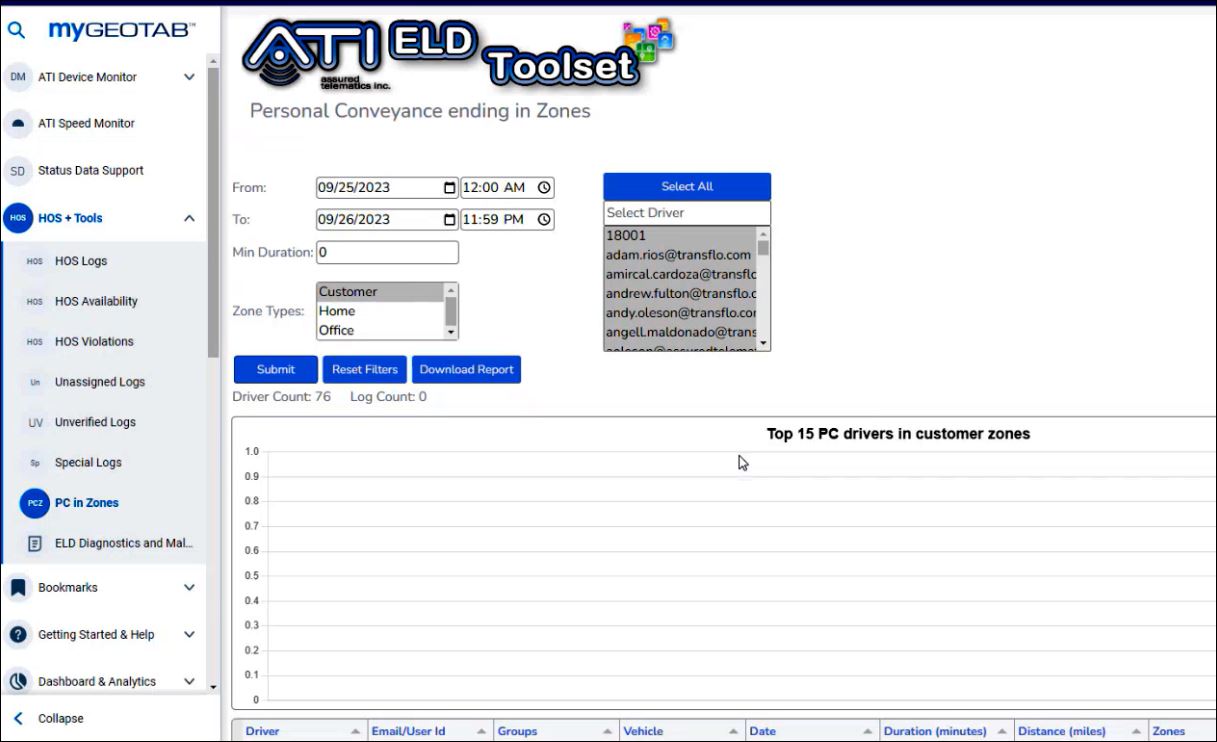
As a fleet manager, to help you track special situations when a driver might run out of available hours and switch to PC just to drive to a client destination site, use the Personal Conveyance (PC) Ending in Zones dashboard.
-
Log in to myGeotab.
-
In the left navigation pane, click HOS+ Tools and then click PC in Zones.
-
Apply one or more of the following options to filter the resulting data:
-
In the From and To date and time fields, set a valid date range for the dashboard report. If your driver and special log counts are typically low, you might run this report every month or every two weeks. To resolve more frequent issues, run the report every week or every few days to observe possible recurring patterns.
-
In the Min Duration field, leave the default value of 0 or set your own minimum duration. For example, your company might require you to identify and enforce a policy where PC exemptions must not exceed 60 minutes.
-
In the Zone Types drop-down list, select one or more values. Hold down the Ctrl key to click more than one value in the list.
Zone Types:
-
Customer
-
Home
-
Office

Tip: Typically, a driver in a customer zone must be in Drive (D) or ON duty HOS status and not PC.
-
-
In the Select Driver field, select one or more drivers. To include all drivers in the dashboard report, click Select All.
-
Click Submit.
-
-
(Optional) To clear your filter data and start over, click Reset Filters.
No documentation is available for this dashboard at this time. Depending on your subscription and permissions, you might have access to this dashboard in the myGeotab portal.
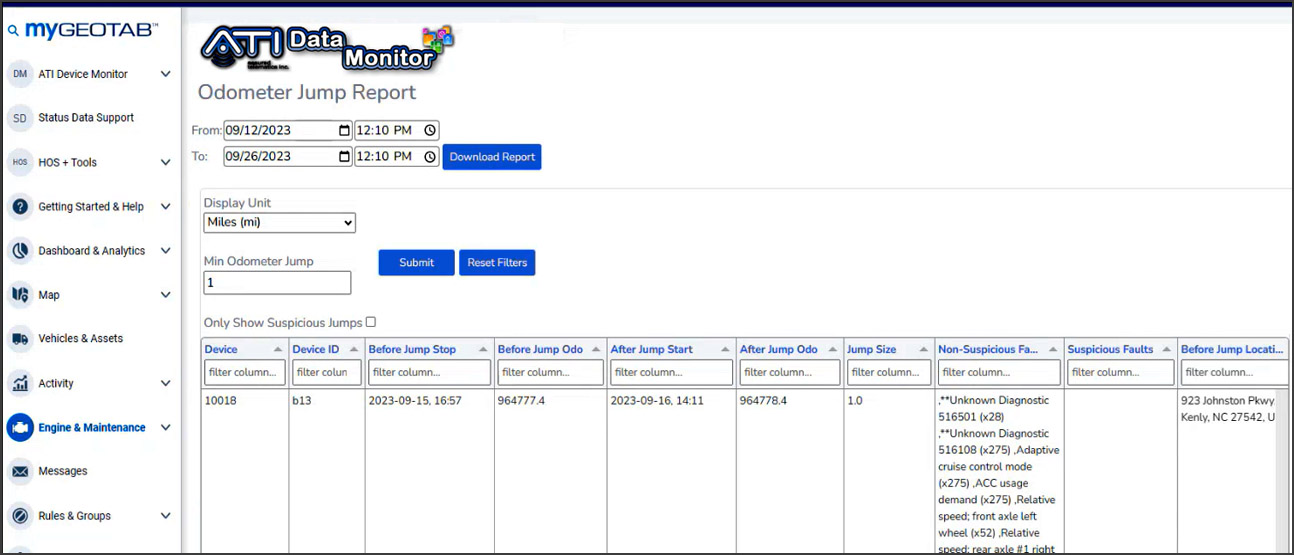
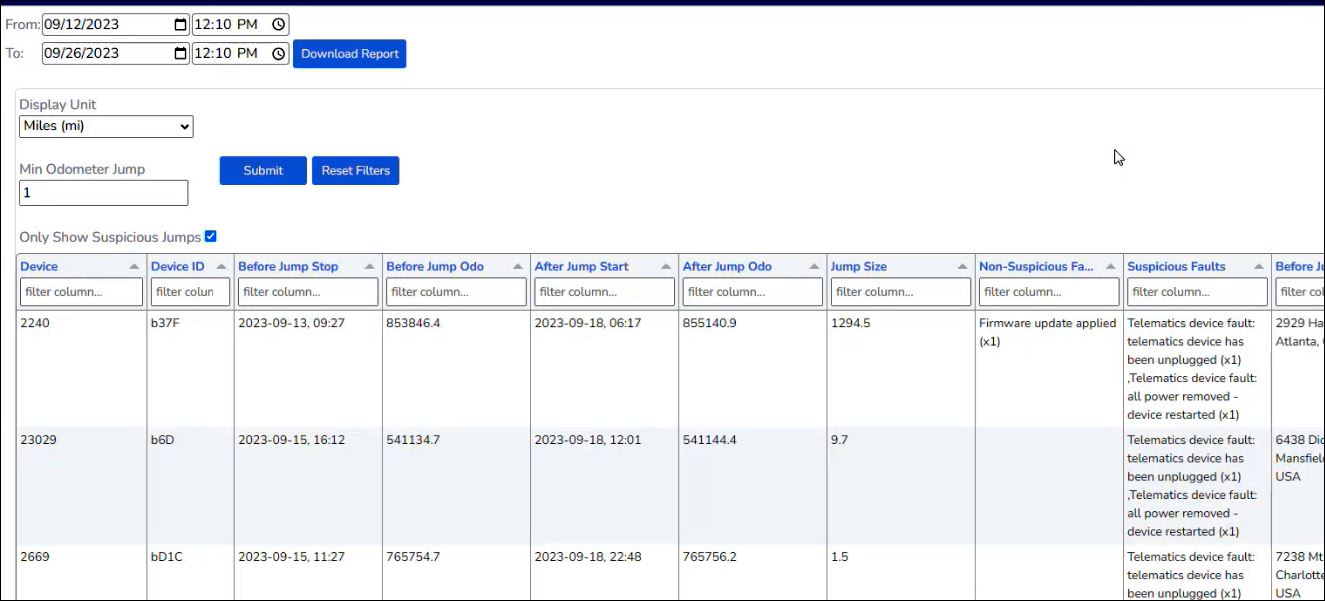
As a fleet manager, you want to know if any ELDs are reporting significant jumps in their odometer readings. As certified ELD telematics providers, ATI and Transflo want to provide you with highly accurate odometer readings and access to data-driven tools to identify and correct potentially significant odometer jumps.
-
Log in to myGeotab.
-
In the left navigation pane, expand Engine and Maintenanceand click Odometer Jumps.
-
Apply one or more of the following filters to filter the resulting data:
-
Use the From and To date and time fields to set a valid date range for the dashboard report.
-
In the Display Unit field, choose miles or kilometers.
-
In the Minimum Odometer Jump field, enter a minimum threshold such as 10 miles to exclude small jumps and focus only on larger jumps over 10 miles.
-
Click Submit.
-
(Optional) To clear your filter data and start over, click Reset Filters.
-
-
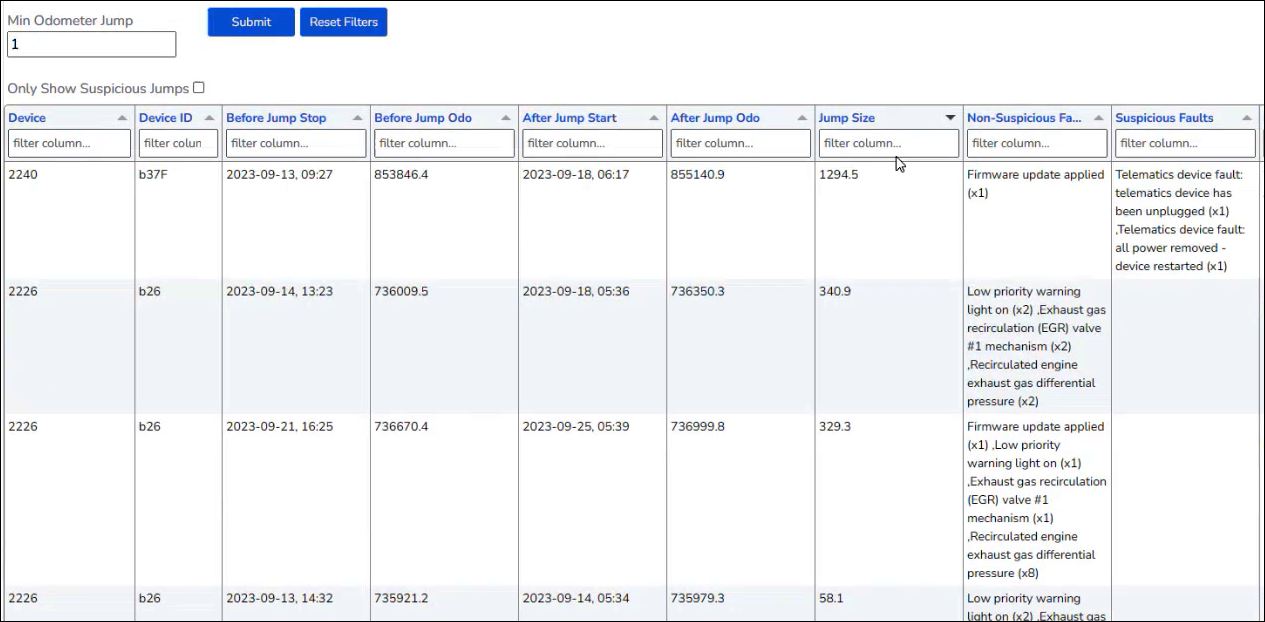
Review the resulting list of jumps by device including the date and time that elapsed between the stop and start cycle and the size of the jump (was it 1.0 mile, 15 miles, or 400 miles).
-
Click on the Jump Size column heading to sort the rows from high to low. (Click it again to toggle the sort order from low to high.)
-
To show only suspicious jumps and faults that typically indicate an attempt to unplug or remove an ELD from service to get more hours, select the Show Only Suspicious Jumps option.
-
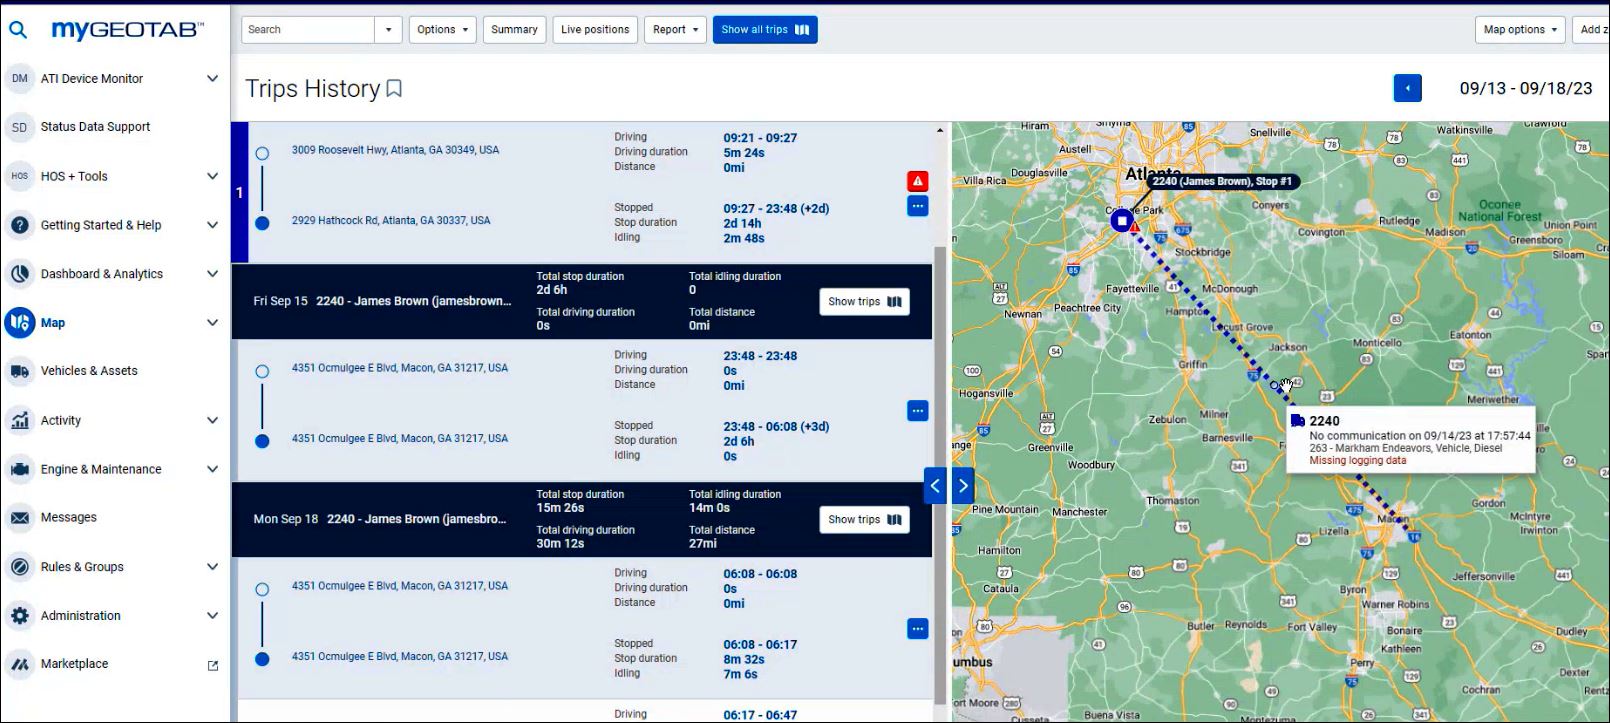
To examine the route including any changes in location, driver, or co-driver, click Trip Link.
-
The Trips History page shows the ELD jump as a straight line from point A where a driver unplugged their ELD to point B where a driver plugged it back in.
-
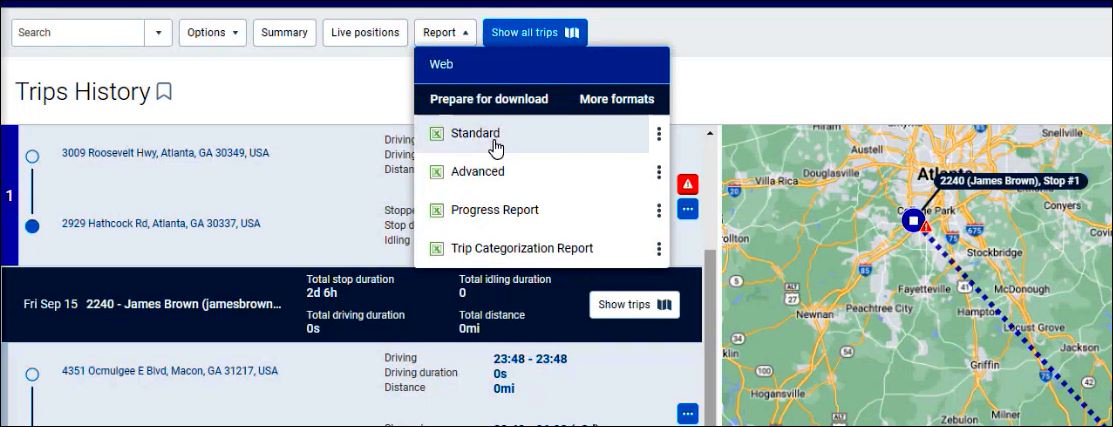
Contact the driver to discuss your company policies and procedures for managing suspicious faults and odometer jumps. To export a copy of the trip report to share with the driver, click Report and then choose Standard or Advanced.
This popular dashboard is essential for troubleshooting fleet ELDs.
In contrast with the default Geotab data that might tell you which devices are out of service for so many days, use the ATI dashboards to focus your attention on specific issues impacting your fleet operations.
-
Log in to myGeotab.
-
In the left navigation pane, expand ATI Device Monitor and click Dashboard.
-
We recommend that you apply a global filter to focus on the data most important to you.
-
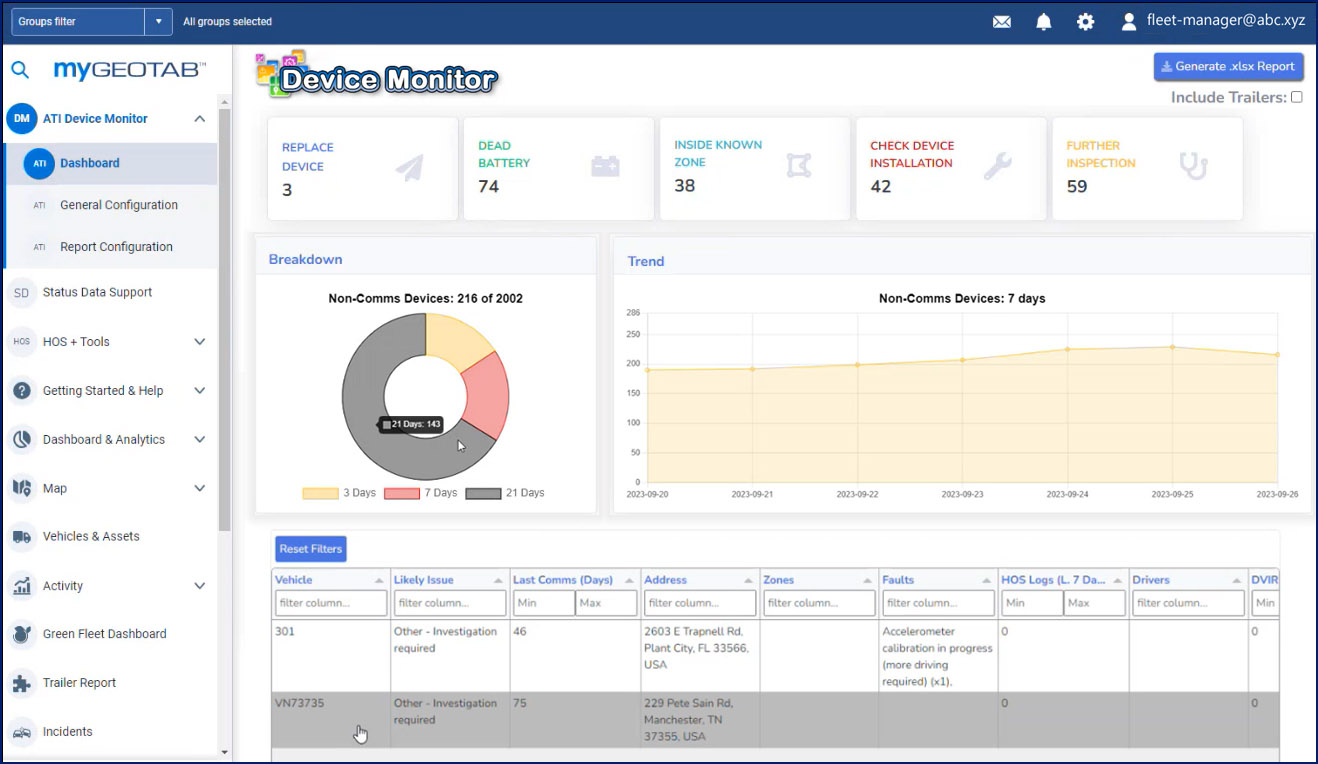
Review the resulting ATI Device Monitor dashboard:
-
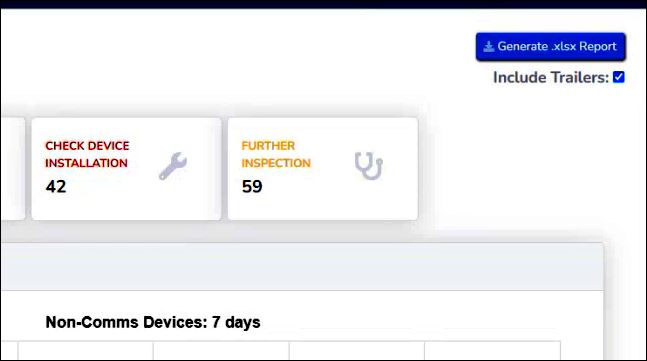
Review the row of tiles at the top (click a tile to see more detailed information):
-
In the Breakdown section, a pie chart shows devices that have not communicated in the configured breakdown period tiers (1, 2, and 3 typically corresponding to 3, 7, and 21 days).
-
The Trend chart shows non-comm devices over the last seven (7) days.
-
Scroll down to the bottom to review, sort, and scroll through the device list. The Faults column indicates essential data about each non-communicating ELD such as firmware update in progress, telematics device unplugged, low vehicle battery voltage, and more.
-
To search or filter the device list, enter your search criteria in any of the filter column or Min Max fields. To clear the filters and see all data again, click Reset Filters.
-
-
To include trailers to identify which ones are up and which ones are down, select the Include Trailers option.
As a fleet administrator, you can configure the settings and zones that determine how much data appears on your ATI Device Monitor dashboard.
-
Log in to myGeotab.
-
In the left navigation pane, expand ATI Device Monitor and click General Configuration.
-
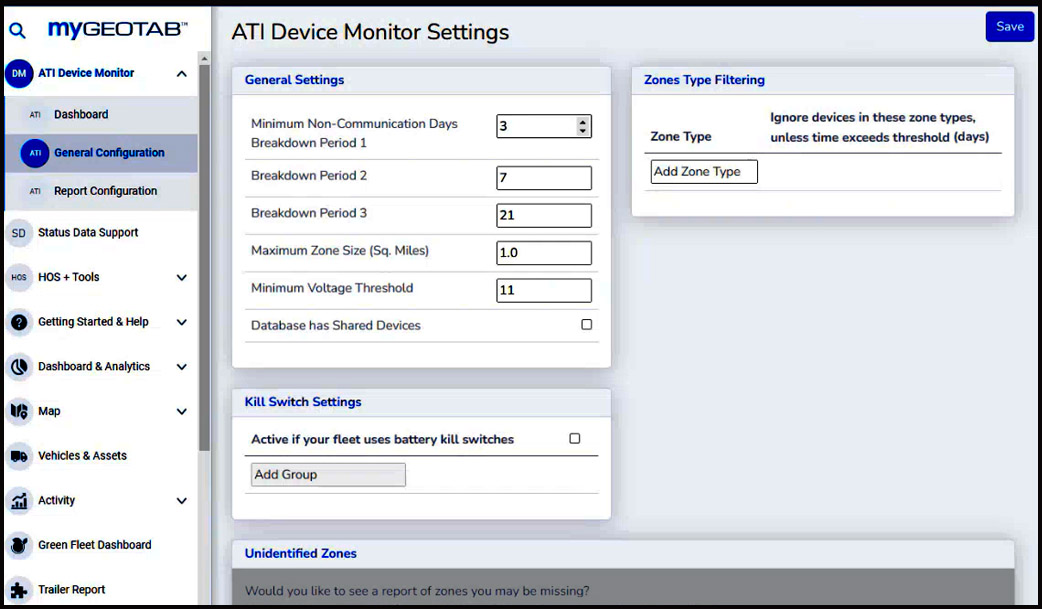
On the ATI Device Monitor Settings page, you can adjust the default values:
-
In the General Settings section, you can adjust number of days for the breakdown periods, the maximum zone size in square miles, the minimum voltage threshold, and shared device database settings.
-
In the Kill Switch Settings section, if your fleet uses battery kill switches, you can add one or more groups configured with kill switches. A kill switch cuts off power to save vehicle battery life. After kill switch activation, the truck and ELD have no power. Specify which groups have kill switches so this dashboard report does not show these devices as having no power for unknown reasons when in reality their kill switch is doing its job to save battery life.
-
In the Unidentified Zones section, you can arrange to have an automated report capture one or more missing zones.
-
In the Zone Type Filtering section, you can specify which zones should be ignored in the dashboard. For example, you can exclude ELD non-communication issues for known devices inside trucks that might be out for repairs or parts for a couple weeks.
Zone Type Examples:
-
Customer
-
Home
-
Office
-
Custom Company A
-
Custom Company B
-
Receiver
-
Shipper
-
Repair Shop (maintenance, parts, or body shop)
-
-
-
To save your changes, click Save.
You can view ELD telematics fuel data by vehicle or driver.
The Fuel by Vehicle dashboard is a standard Transflo Telematics report in the myGeotab portal.
-
Log in to myGeotab.
-
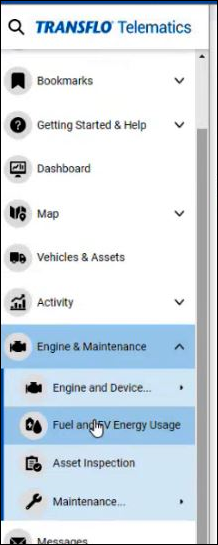
In the left navigation pane, expand Engine and Maintenance.
-
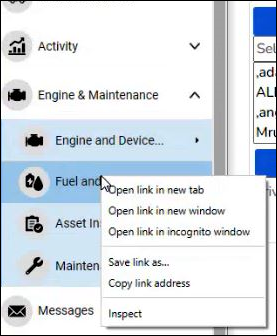
Right-click on Fuel and EV Energy Usage and choose Open link in new tab or window.
-
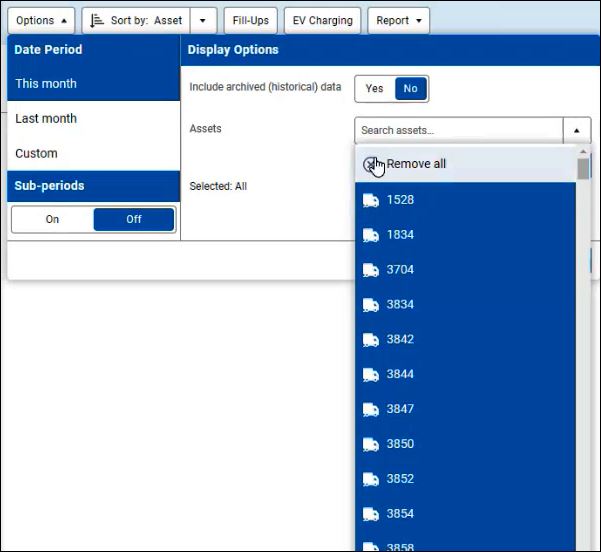
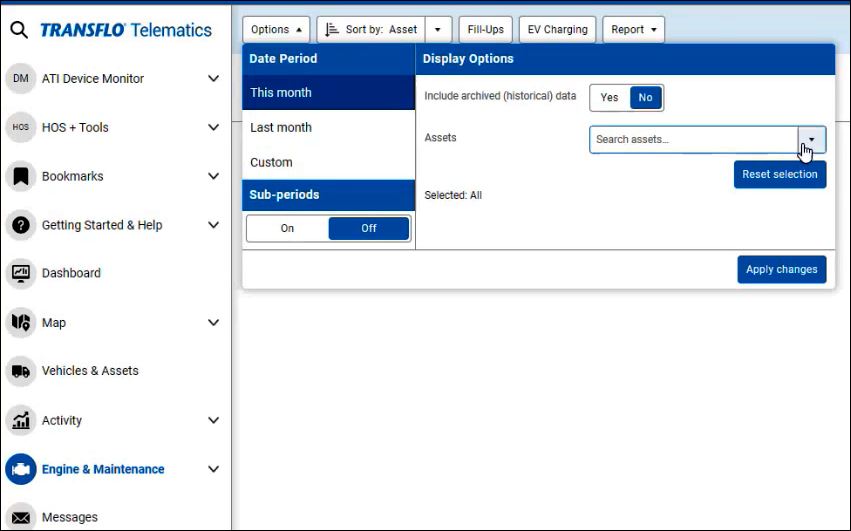
Apply one or more of the following filters to filter the resulting data:
- The resulting report is by vehicle (assets). As a fleet manager, it is important that you understand the difference between the default myGeotab report by vehicle and the special ATI Fuel by Driver dashboard report.
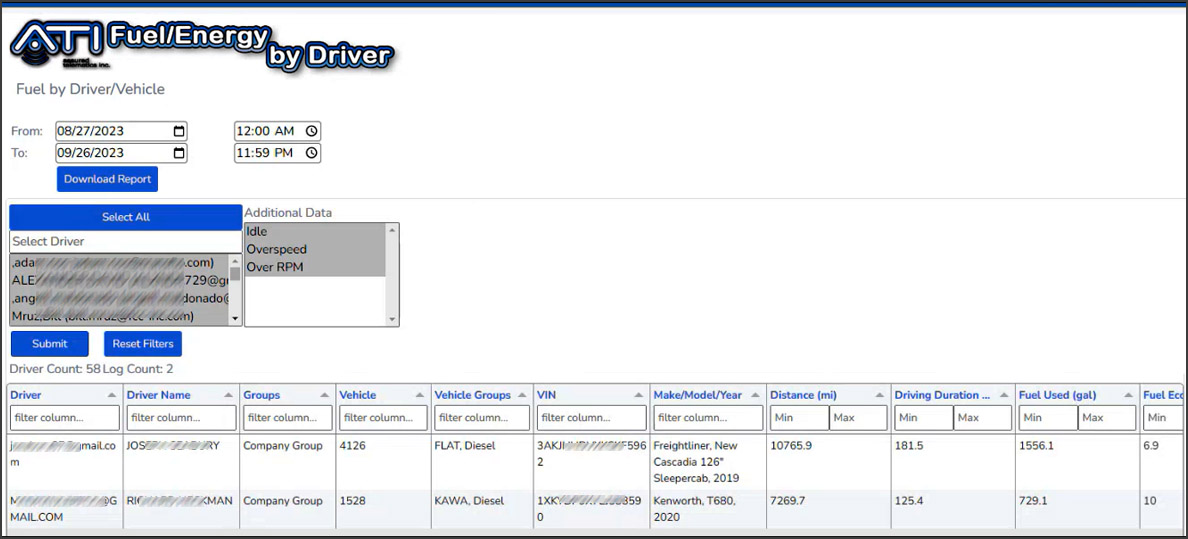
ATI offers a Fuel by Driver report, often considered an essential companion to the standard Fuel by Vehicle report.
-
Log in to myGeotab.
-
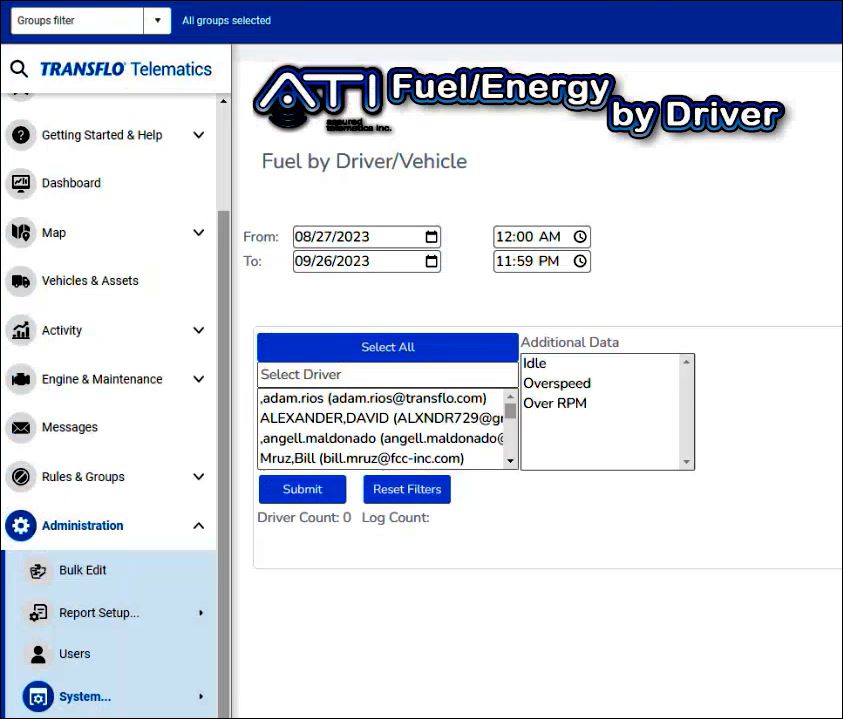
In the left navigation pane, expand Administration and click System. Choose ATI Fuel and Energy by Driver.
-
Apply one or more of the following filters to filter the resulting data:
-
Use the From and To date and time fields to set a valid date range for the dashboard report.
-
In the Select Driver field, select one or more drivers. To include all drivers in the dashboard report, click Select All.
-
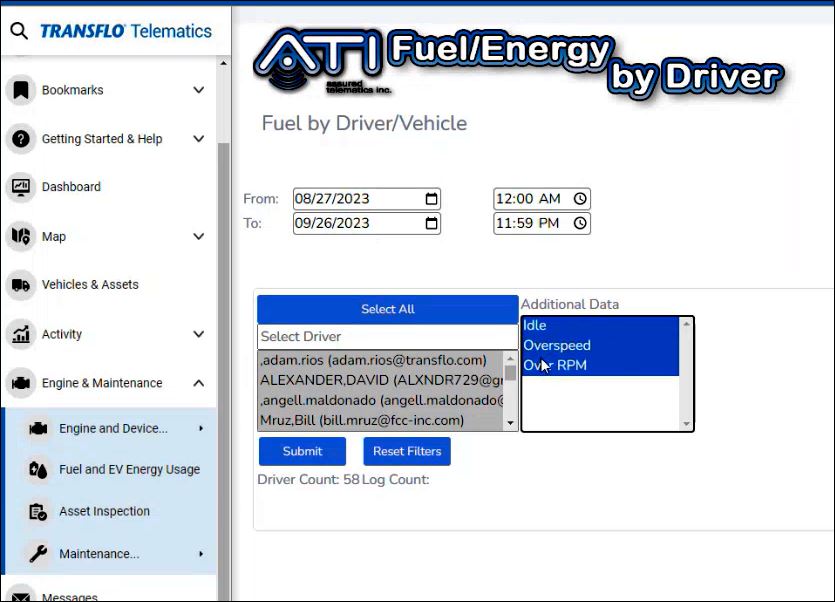
In the Additional Data field, select one or more options including Idle, Overspeed, and Over RPM. Hold down the Ctrl key while you click to select multiple entries.
-
Click Submit.
-
(Optional) To clear your filter data and start over, click Reset Filters.
-
-
This ATI report is by driver.
-
The dashboard report by driver shows fuel metrics by driver.
-
Make sure you scroll left and right to view all the fields (columns) in this report to gauge the impacts on fuel usage due to poor idle, RPM, and speed management. Use this data for driver training to adjust behaviors and practices.
fuel tracker
