Transflo Workflow AI Executive Dashboard
This article explains how to use the Executive Dashboard in Transflo Workflow AI for Brokers. Early in 2024, a new Executive Dashboard was added to all production and user-acceptance testing (UAT) environments. Managers, administrators, and other authorized team leaders can use the dashboard on a daily basis to manage their exceptions, track staff progress, and present a standard set of target metrics to senior management and executive staff. The dashboard also includes export functions.
-
Log in to Transflo Workflow AI for Brokers as a user with sufficient security access to the new dashboard (as configured by your administrator).

-
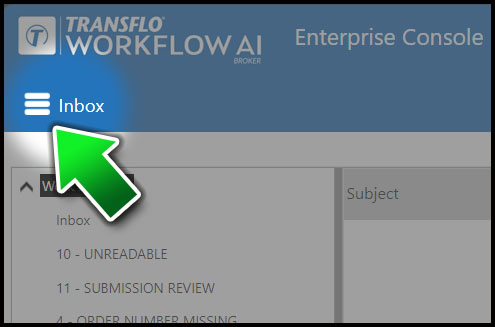
On any page or screen of the Enterprise Console, click the ≡Inbox drop-down menu.

-
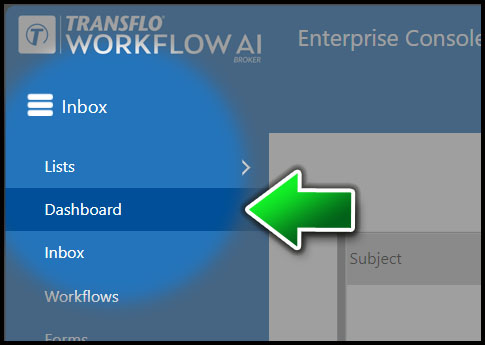
Choose Dashboard.


Note: Your administrator can configure the position of menu items. The placement of the Dashboard entry in your environment may vary.
-
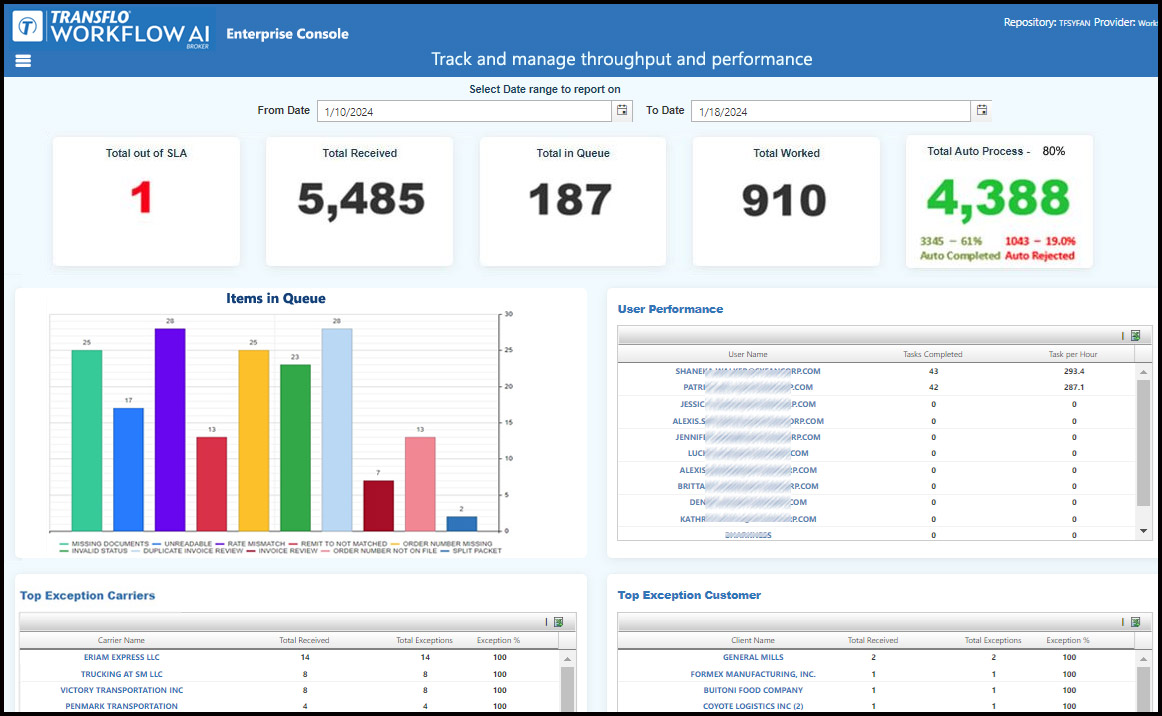
The Executive Dashboard appears.

-
The default date range is the last seven (7) calendar days. You can set your own date range for the dashboard to focus on a particular day, week, month, quarter, or any other time period. Enter your choice of dates in the From Date and To Date fields to define your range. Select dates from the convenient drop-down calendars in each field or enter dates directly in MM/DD/YYYY format.
-
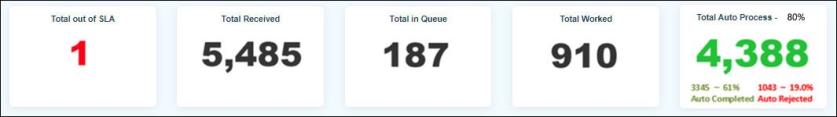
In the row of five (5) tiles at the top of the dashboard, review the following key metrics based on the number of invoices received within your target date range (except Total in Queue which is always a current snapshot):
-
Total Out of SLA: This is an optional feature where you can indicate an SLA for any workflow task. For example, the system can be configured to report any workflow task that is older than 72 hours.
-
Total Received: Represents the number of invoices received during the defined date range.
-
Total in Queue: The total number of current workflow items in all queues with one or more exceptions right now at the time the dashboard is accessed. The date range does not affect this number.
-
Total Worked: The total number of work items with exceptions that received attention by your staff who worked on (approved or rejected) each item during the defined date range.
-
Total Auto Process: The green number (4,388 in the example image) is the total number of automated invoices that were either Auto Completed (automatically approved) or Auto Rejected (duplicate invoices). The Total Auto Process 80% represents the same volume of invoices that automatically flowed through the system without human touch expressed as a percentage. In this example, 4,388 were automatically processed out of 5,485 total invoices received ( 4388/5485 = 80%).
This tile breaks down the number of auto-processed documents and shows you the split totals and percentages for Auto-Completed and Auto-Rejected. Leveraging the power of machine learning and automation, these documents are said to be touchless (these invoices did not require being touched; no manual effort or expenses were required).
-
-
Review one or more of the following charts:
-
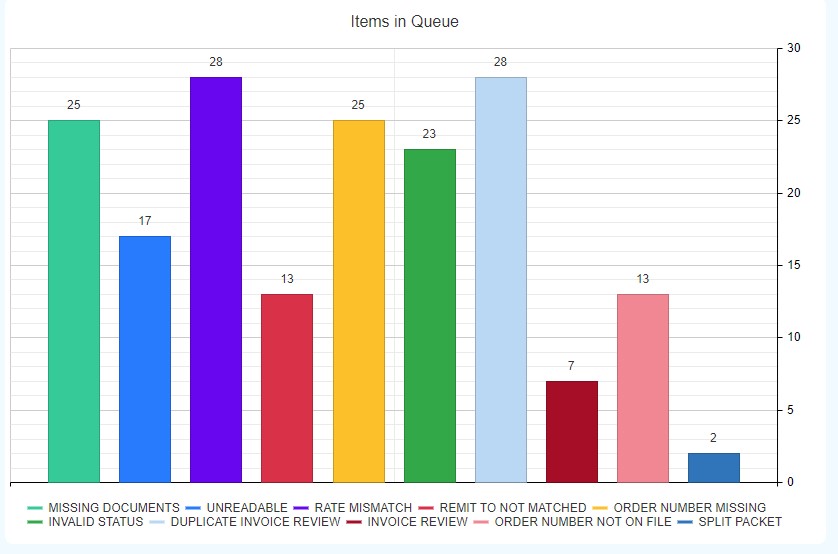
Items in Queue: This graph breaks down the Total in Queue number from the tile at the top of the page. These numbers are not based on a date range but rather all exceptions currently in workflow at the time the dashboard is accessed. This graphical representation of the queues provides a quick view and allows a supervisor to see if a particular queue is overloaded or has abnormally high numbers.

-
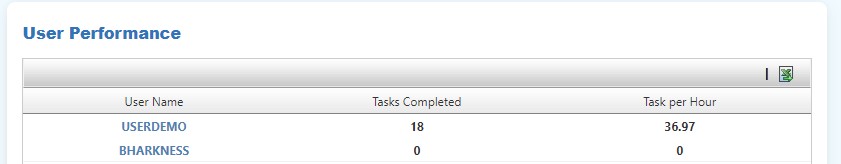
User Performance: This portlet shows the total workflow tasks (exception processing) completed by each user during the defined date range and the current productivity for each user expressed in a Tasks per Hour rate.

The Tasks per Hour rate is calculated as follows:
-
Tasks Completed = The total number of tasks completed within the specified date range.
-
Total Time to Complete = The number of minutes to complete all the completed tasks.
-
Tasks per Hour = The number of tasks completed divided by the total time in minutes multiplied by 60 minutes (one hour).
=(Tasks Completed/Total Time to Complete)*60
Example: User SamJones123 completes 40 tasks in 80 minutes:
-
Tasks Completed = 40
-
Total Time to Complete = 80
-
Tasks per Hour = 30
-
-
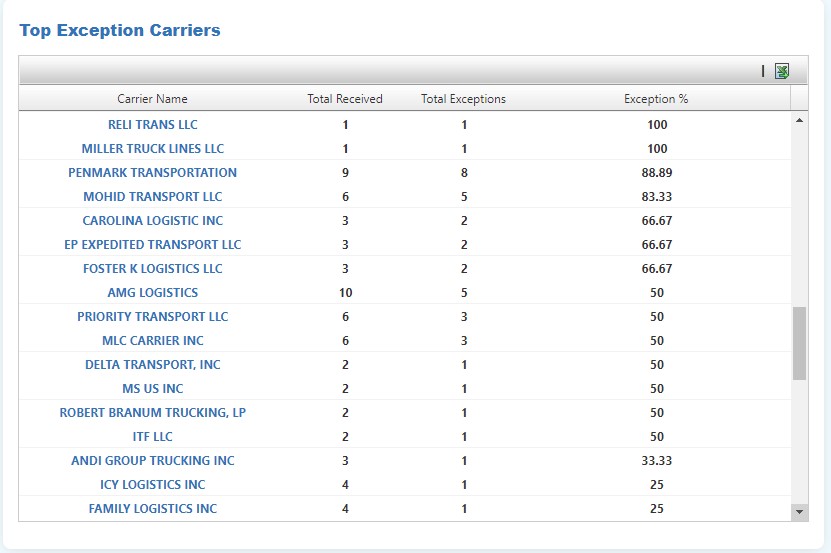
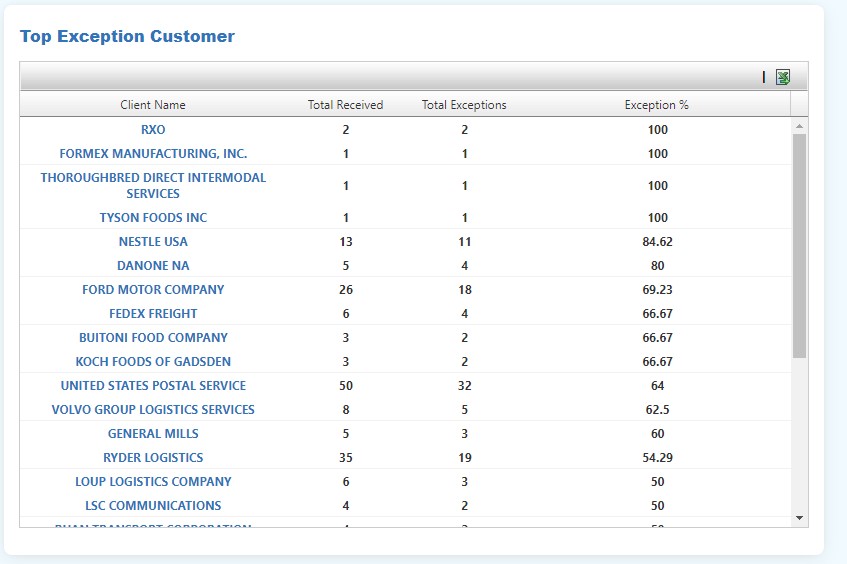
Top Exception Carriers & Customers: One of the great benefits of the Transflo Workflow AI solution is that you can use knowledge workers to improve carrier and customer relations by working with carriers and customers that have high volume and high exception rates.


-
-
(Optional) You can export grid data to a spreadsheet file that you can open in Microsoft Excel, Google Sheets, OpenOffice Calc, and other database or spreadsheet applications. For example, you can export to Excel where you might perform trending analysis or import the data into other applications or presentations to further track and improve performance.
-
At the top right corner of a grid or portlet, click
 Export.
-
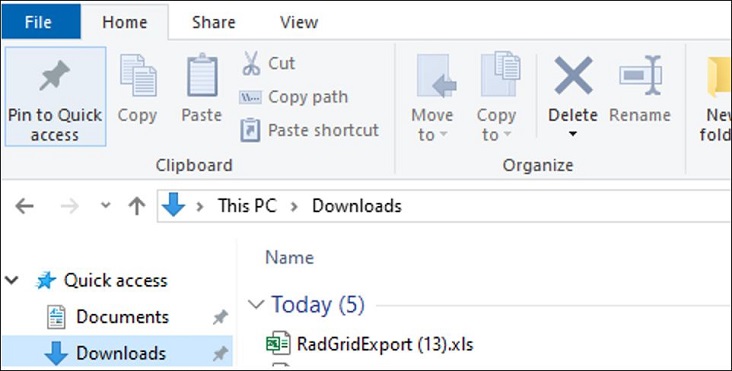
Your web browser downloads the exported data to an XLS file. The following example image shows the Google Chrome browser (top) and Microsoft Edge browser (bottom).

-
You can open the file now or find it later in your Downloads folder and open it in Excel, Google Sheets, or another compatible application.

-